클러스터링이란?
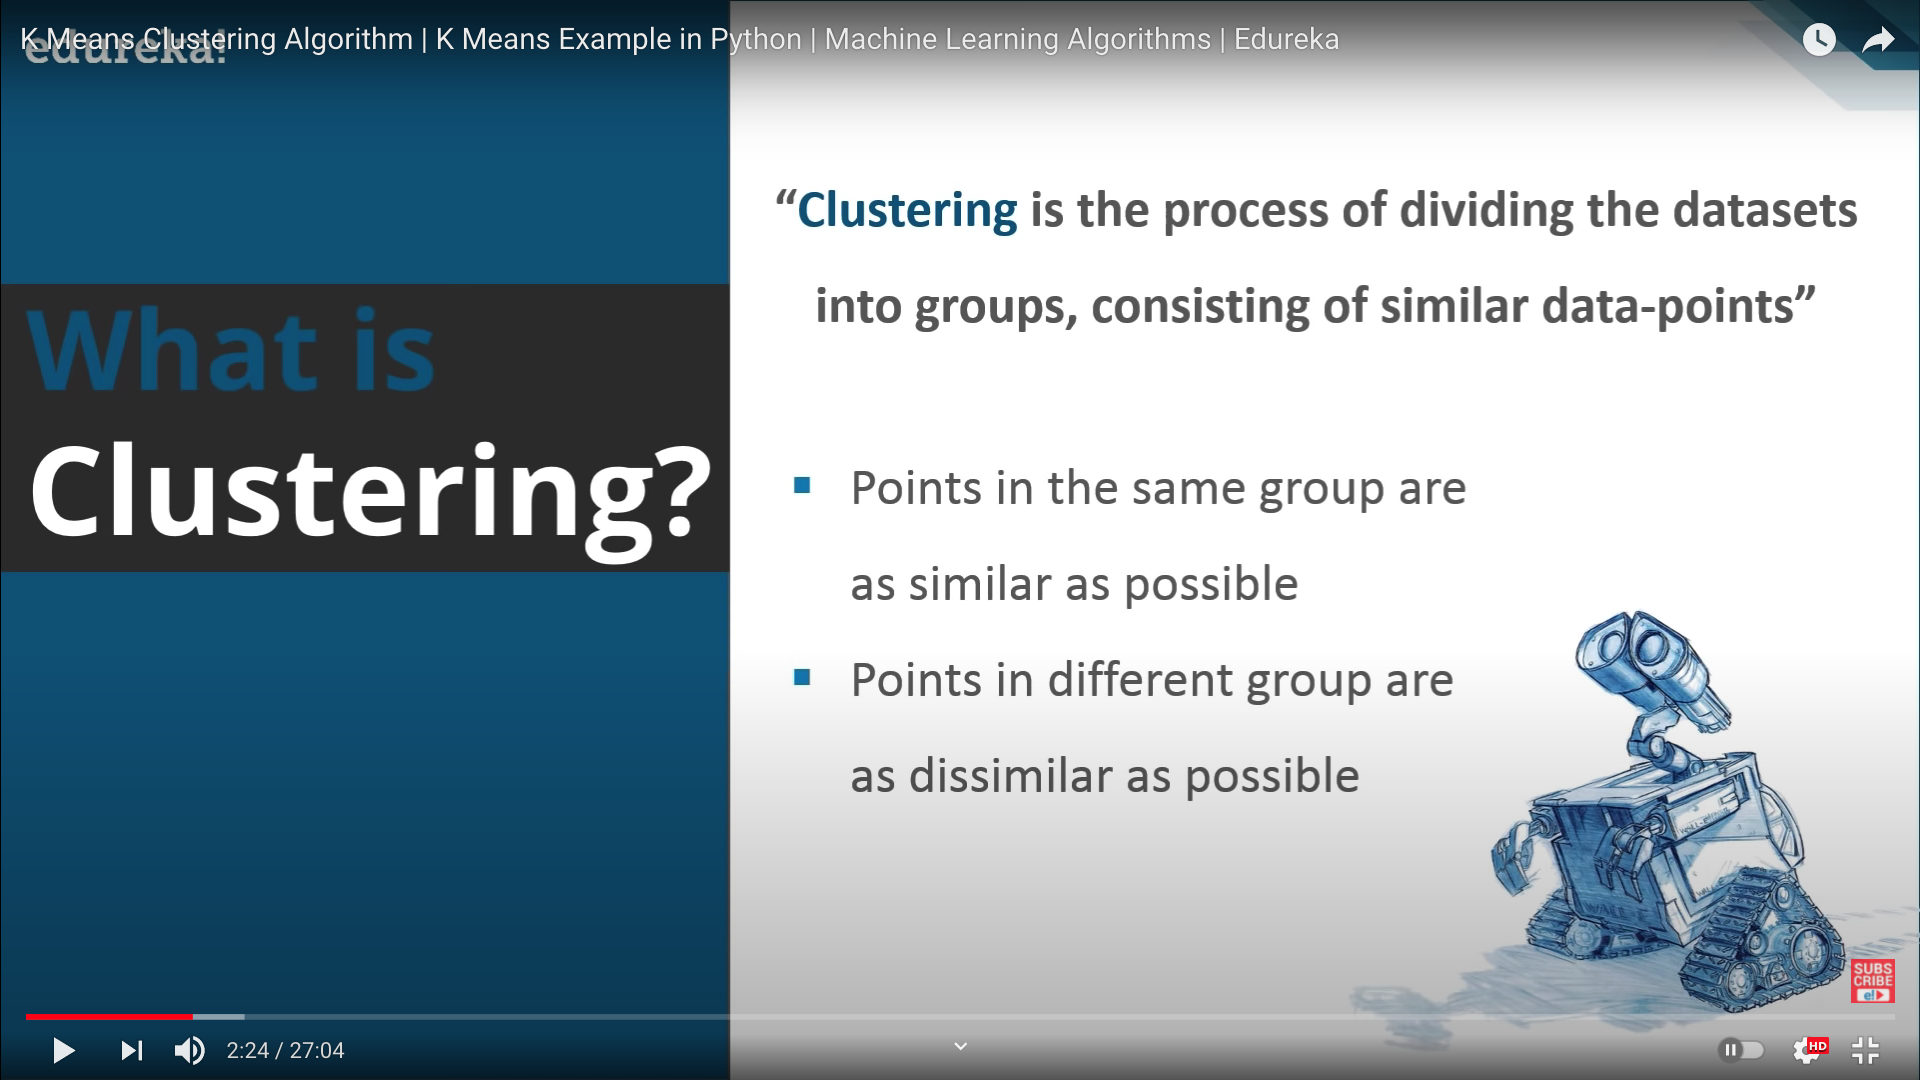
- 클러스터링이란 데이터셋을 그룹별로 나누고 유사한 관측값끼리 구성하는 과정을 말한다.
- 같은 라벨끼리는 최대한 동질성을 유지하고
- 다른 라벨끼리는 최대한 이질성을 유지하려는 속성을 갖음
어디에 쓰입니까?

- 일반적으로 추천 시스템의 군집 분석에 많이 쓰임
클러스터링의 종류
Exclusive Clustering
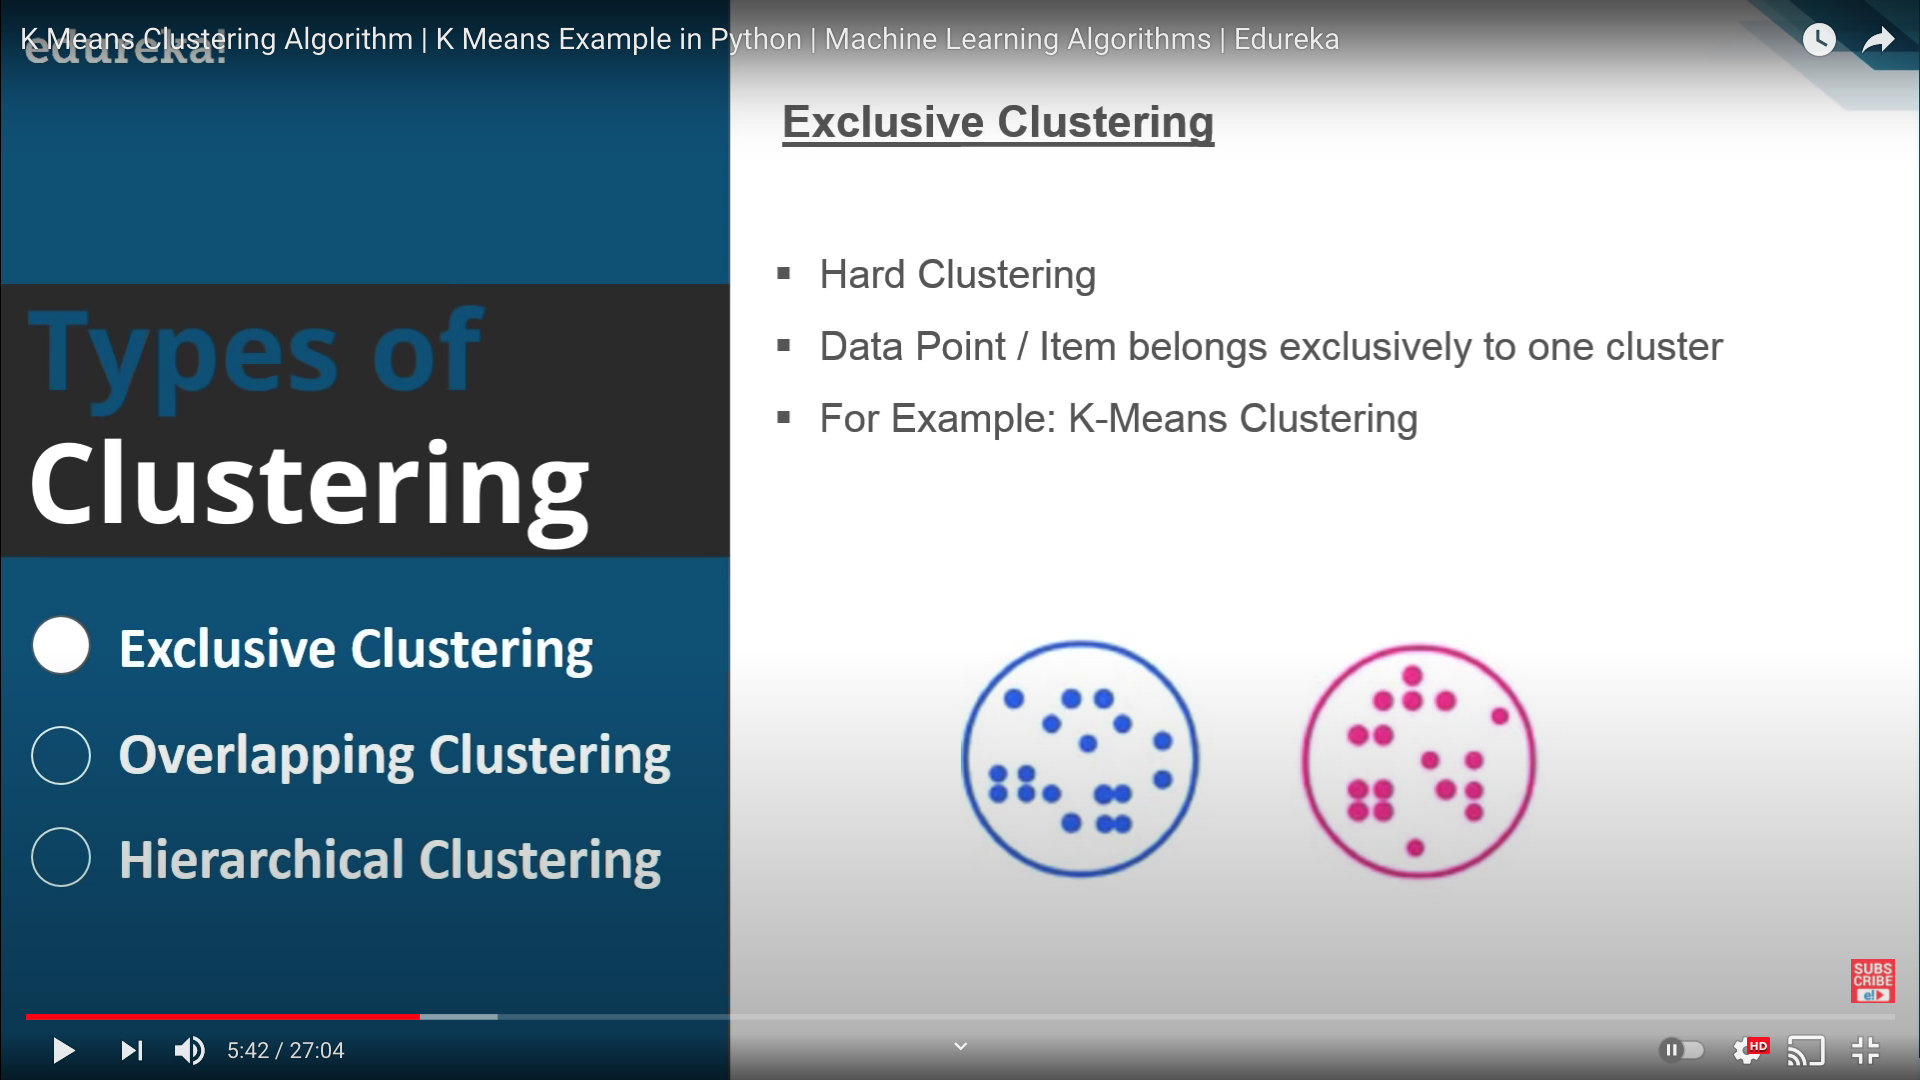
- 엄격한 군집을 구성하며(겹치지 않음)
- 대표적으로 K-Means Clustering이 있겠음
Overlapping Clustering
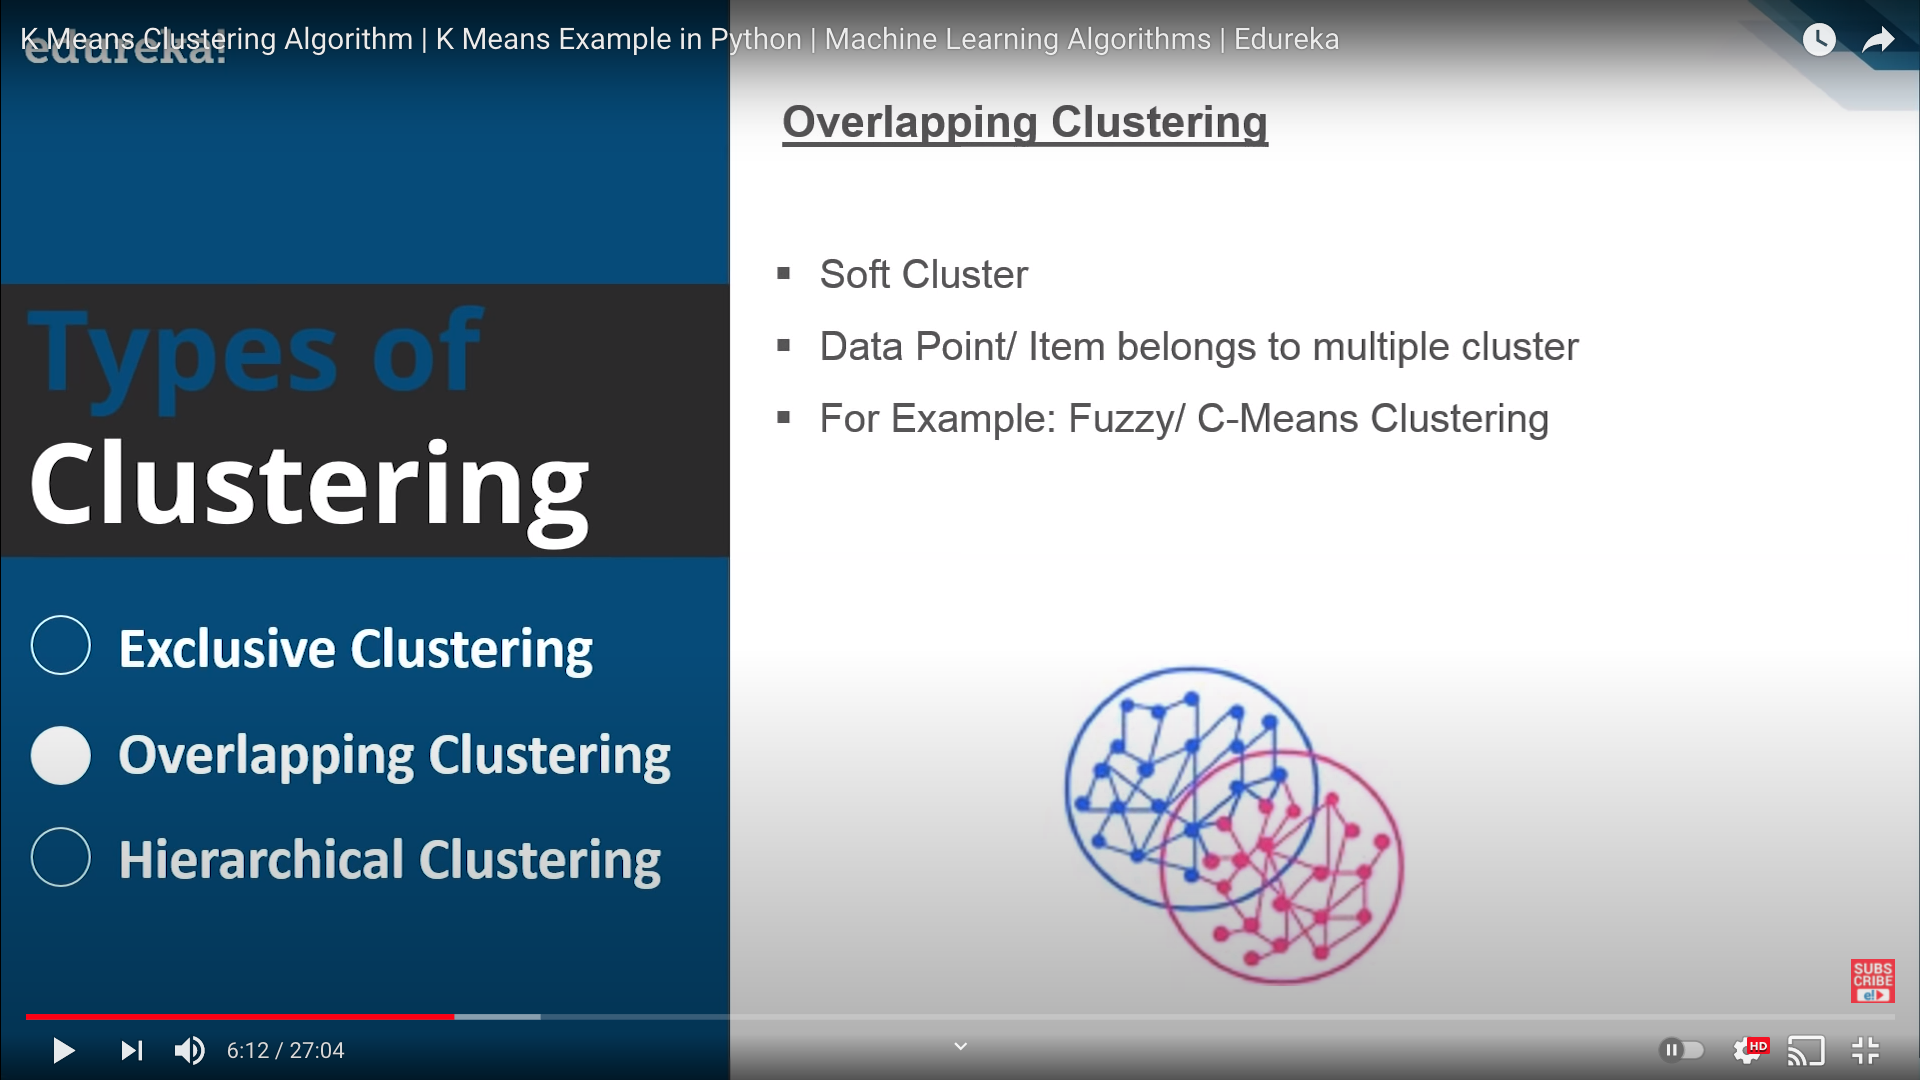
- 군집간 여러개의 속성(라벨)을 갖는 관측값이 존재하며
- Soft Cluster라고도 함
- Fuzzy와 C-Means Clustering 등이 있겠음
Hierarchical Clustering
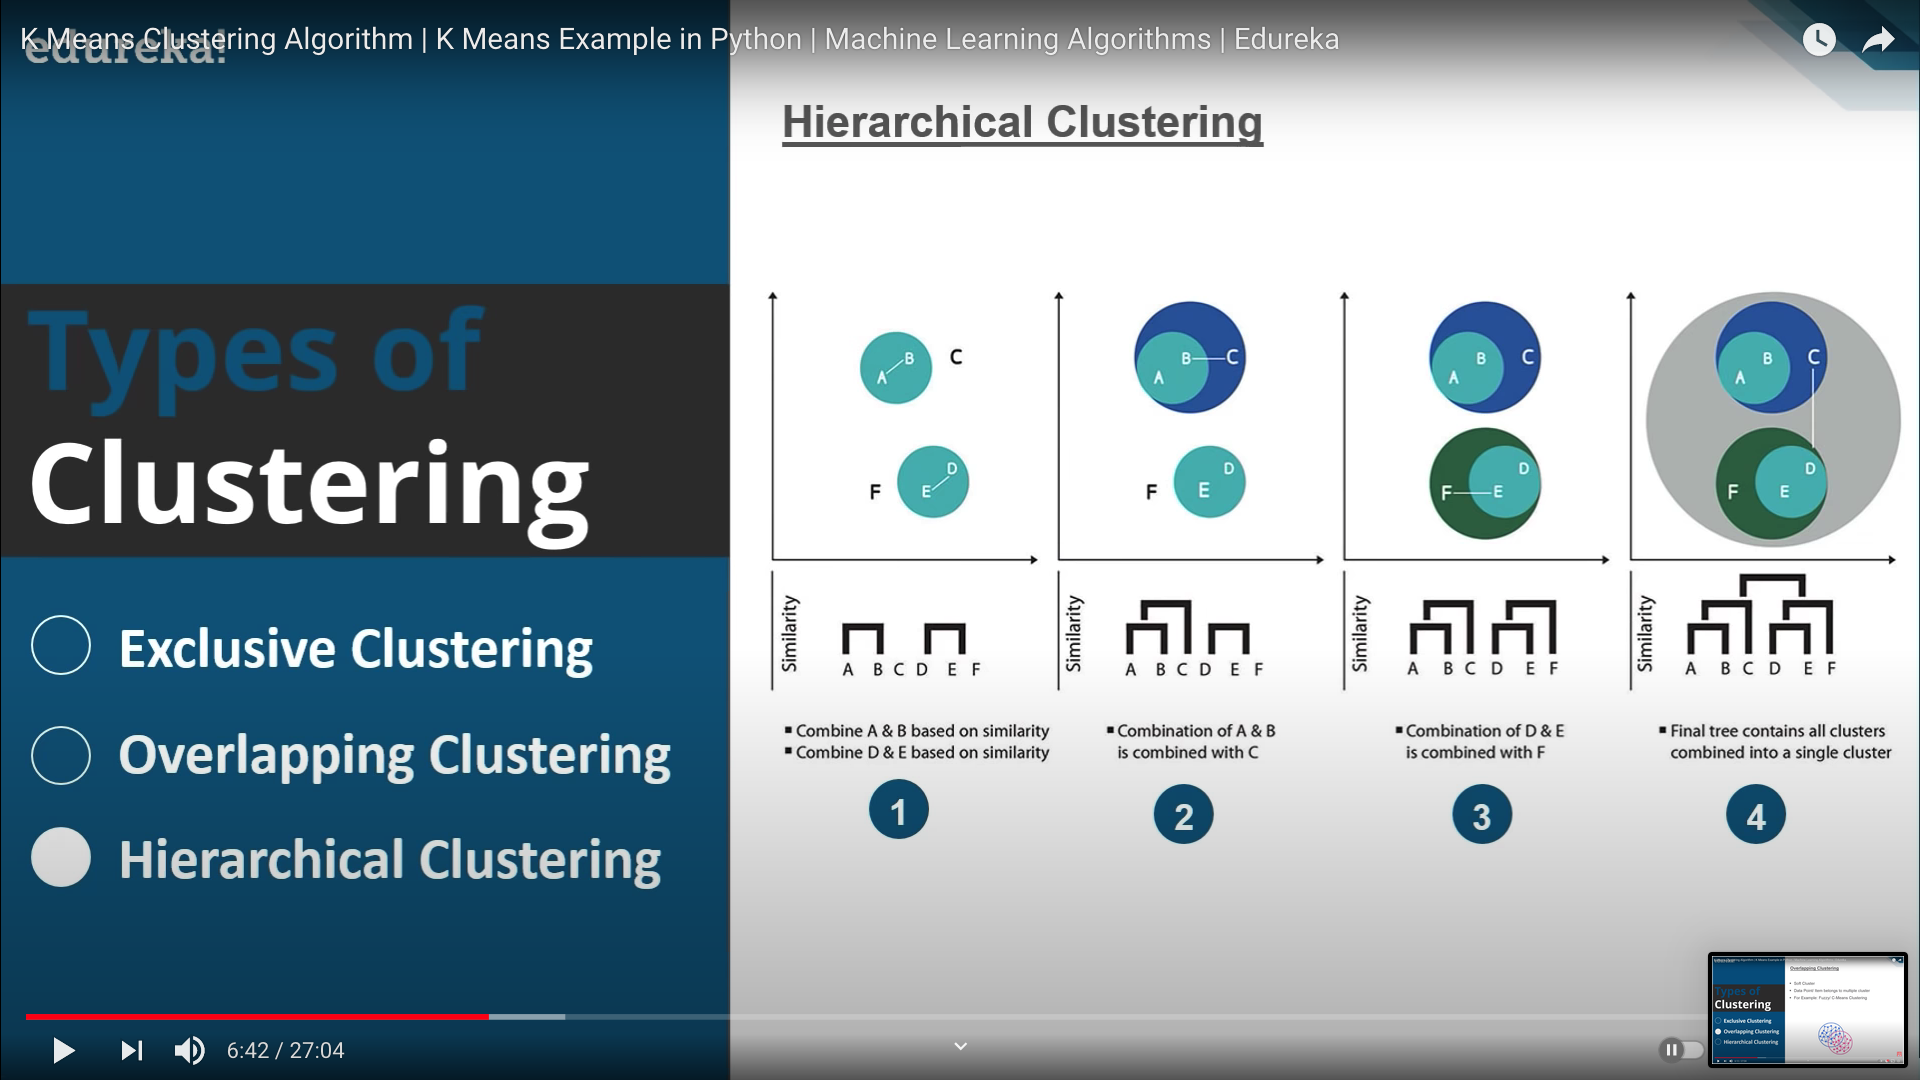
- 두 개의 관측값끼리 위계를 나누며 그루핑하며
- 대표적인 기법으로 댄드로그램 클러스터링이 있겠음
K-Means 클러스터링

- K는 클러스터의 개수를 의미한다.
클러스터링 과정
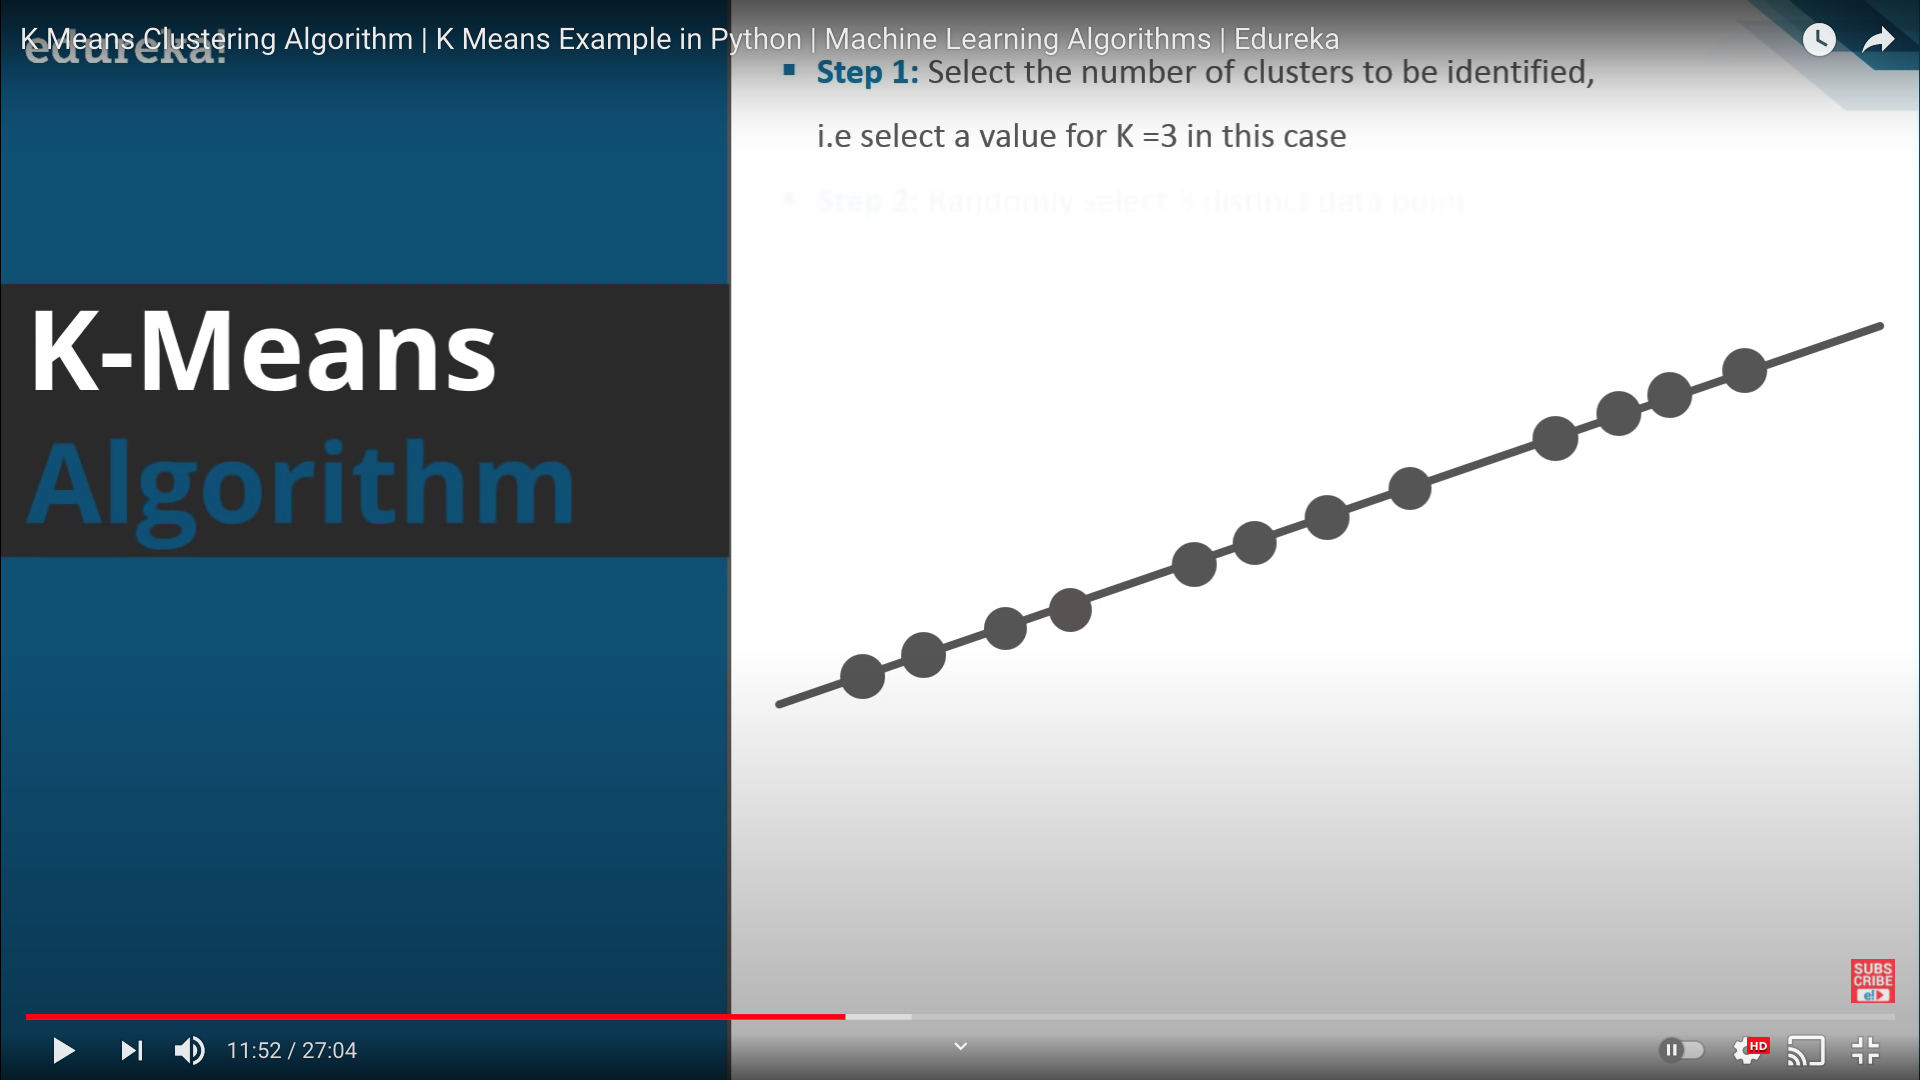
- Step 1: 클러스터의 개수(K) 선택(예제에서는 3개)
- Step 2: 무작위로 K개의 data point 선택
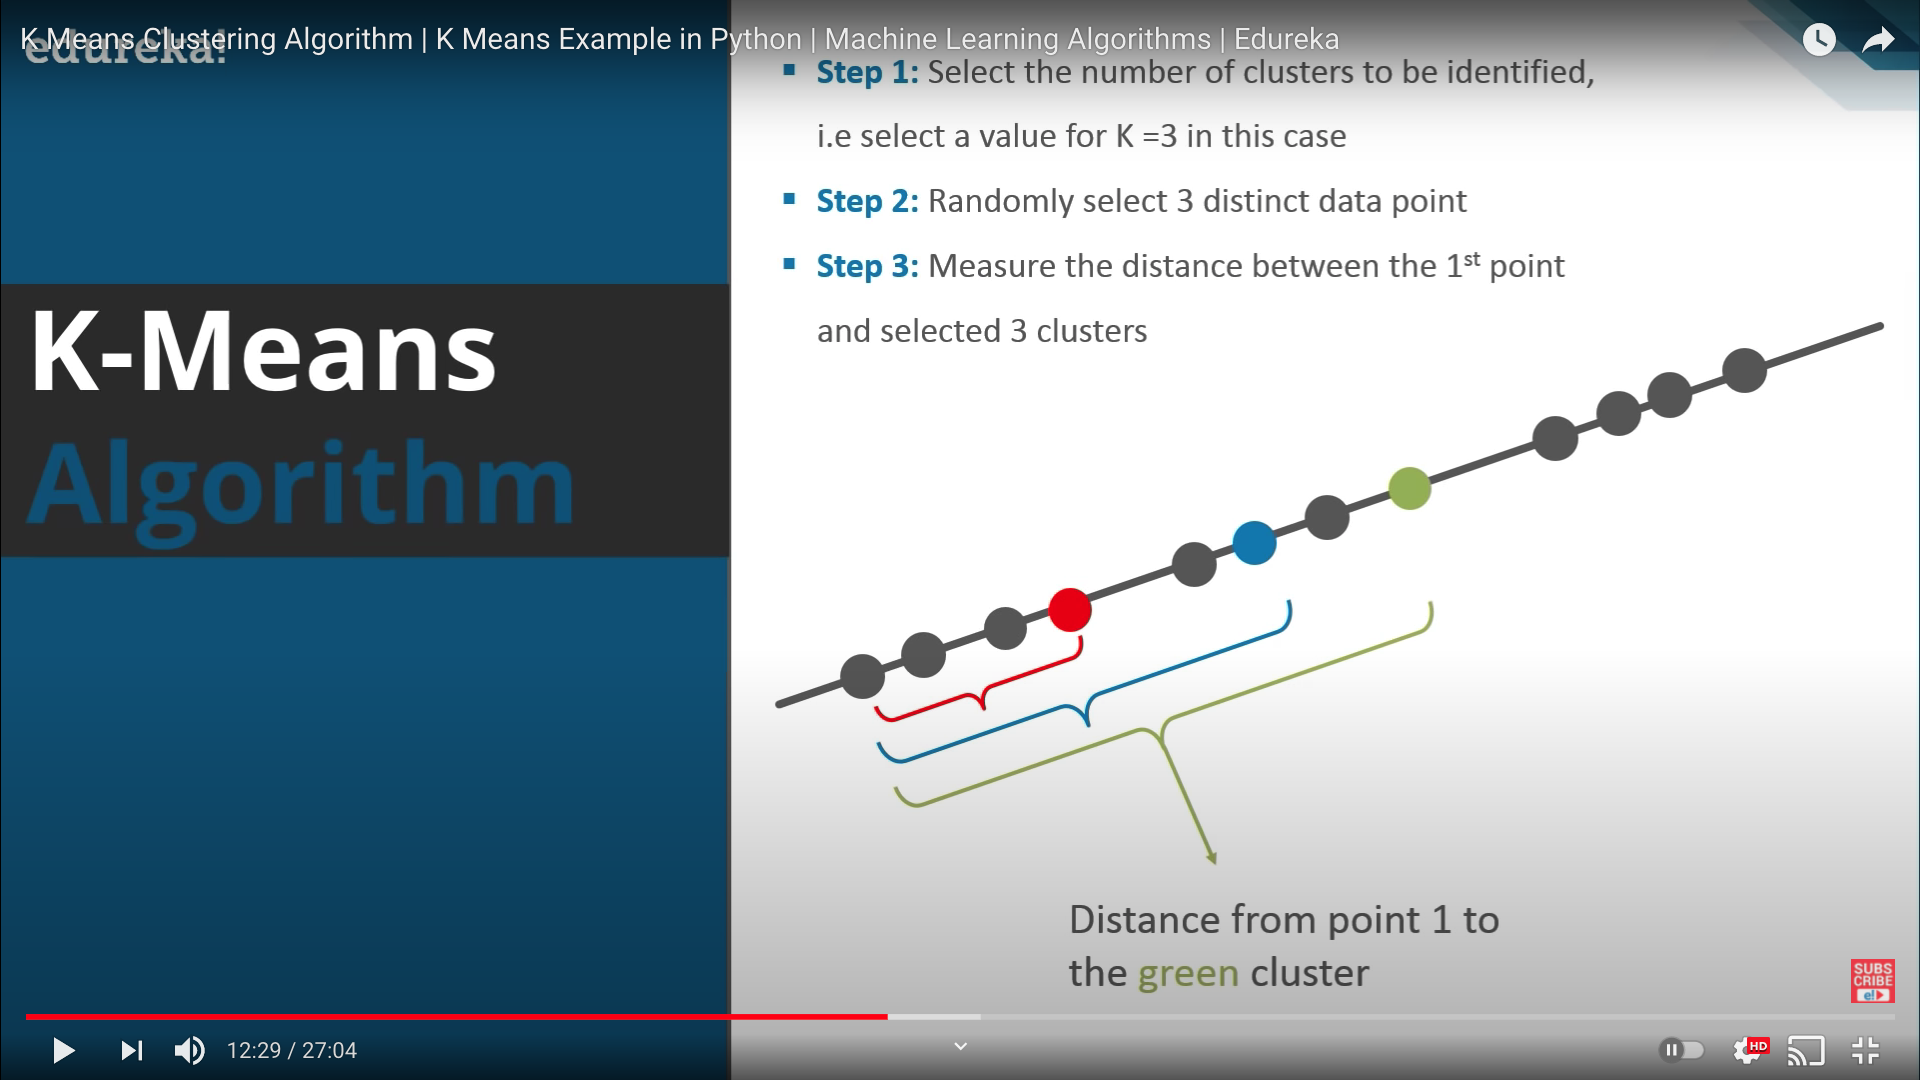
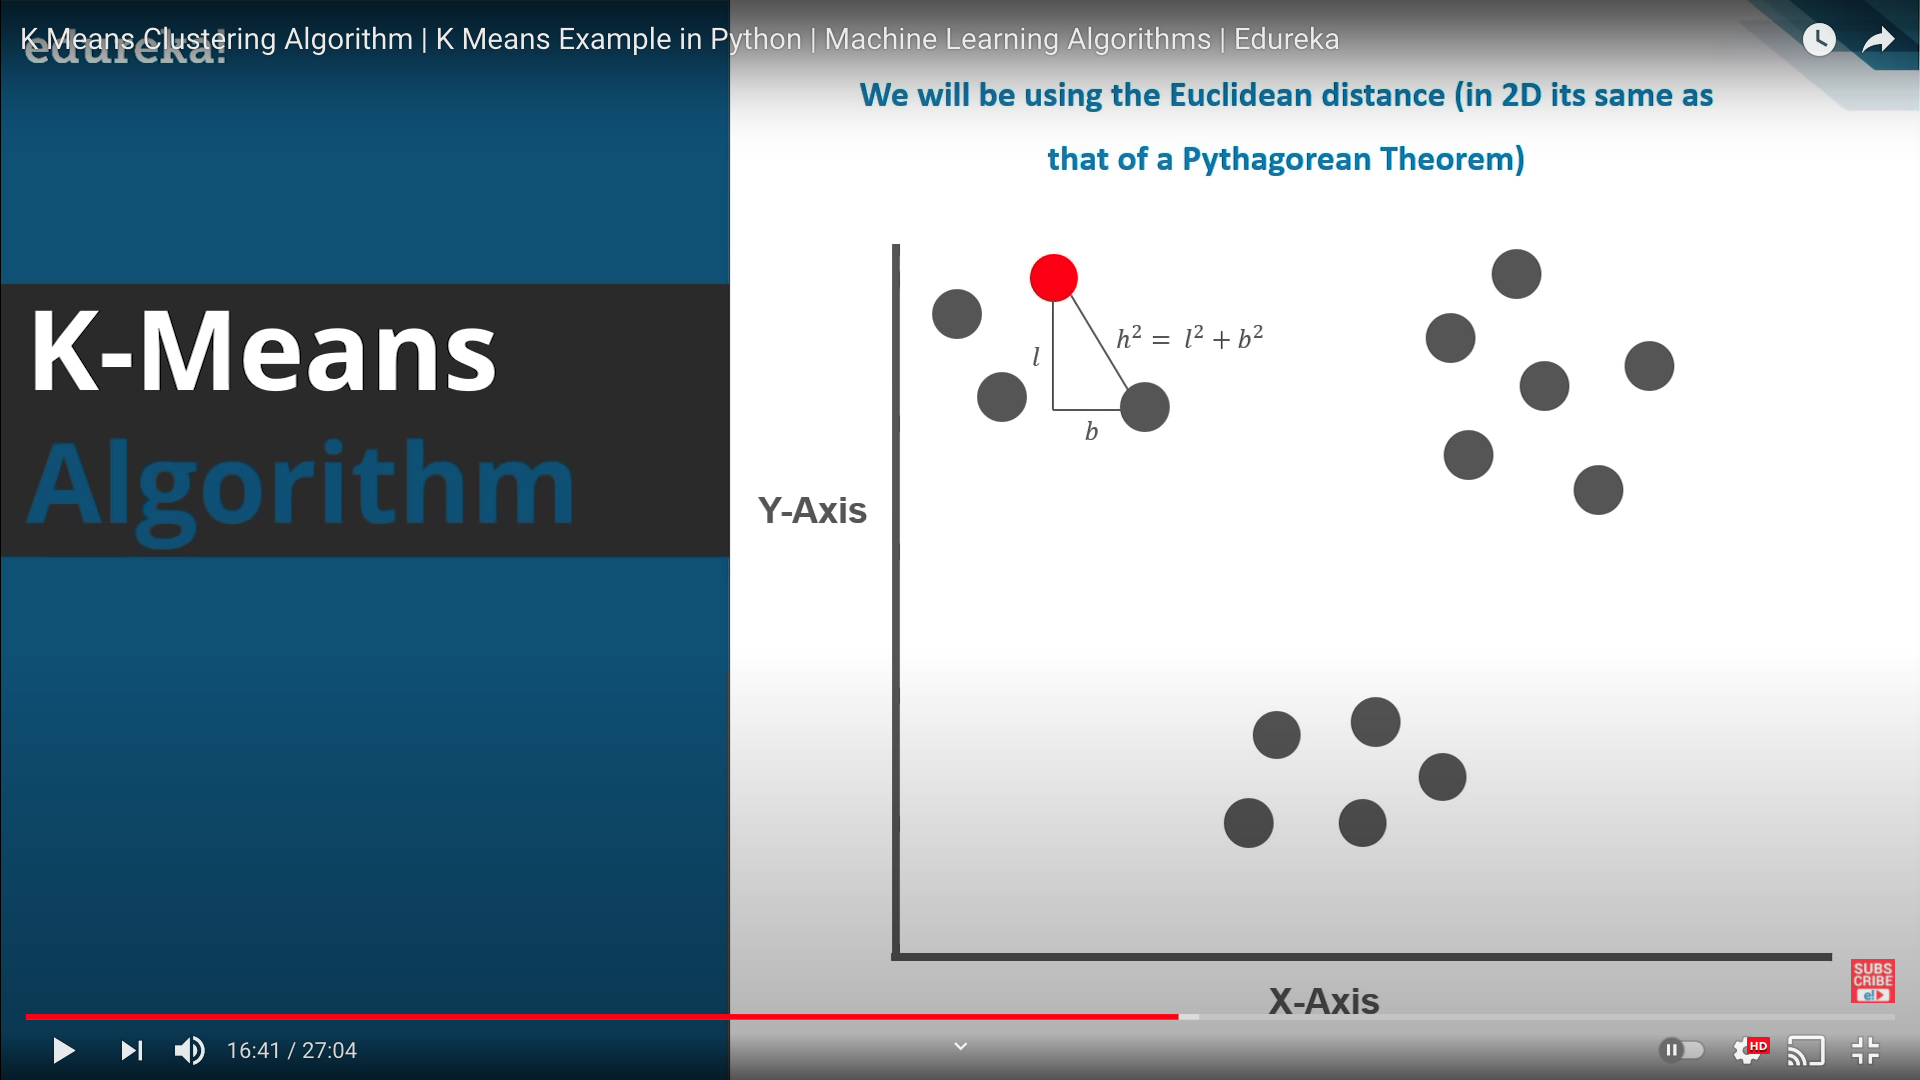
- Step 3: 관측값의 첫번째 값부터 순서대로 가장 가까운 클러스터 탐색(차원에 따라 거리계산 기법이 달라짐)
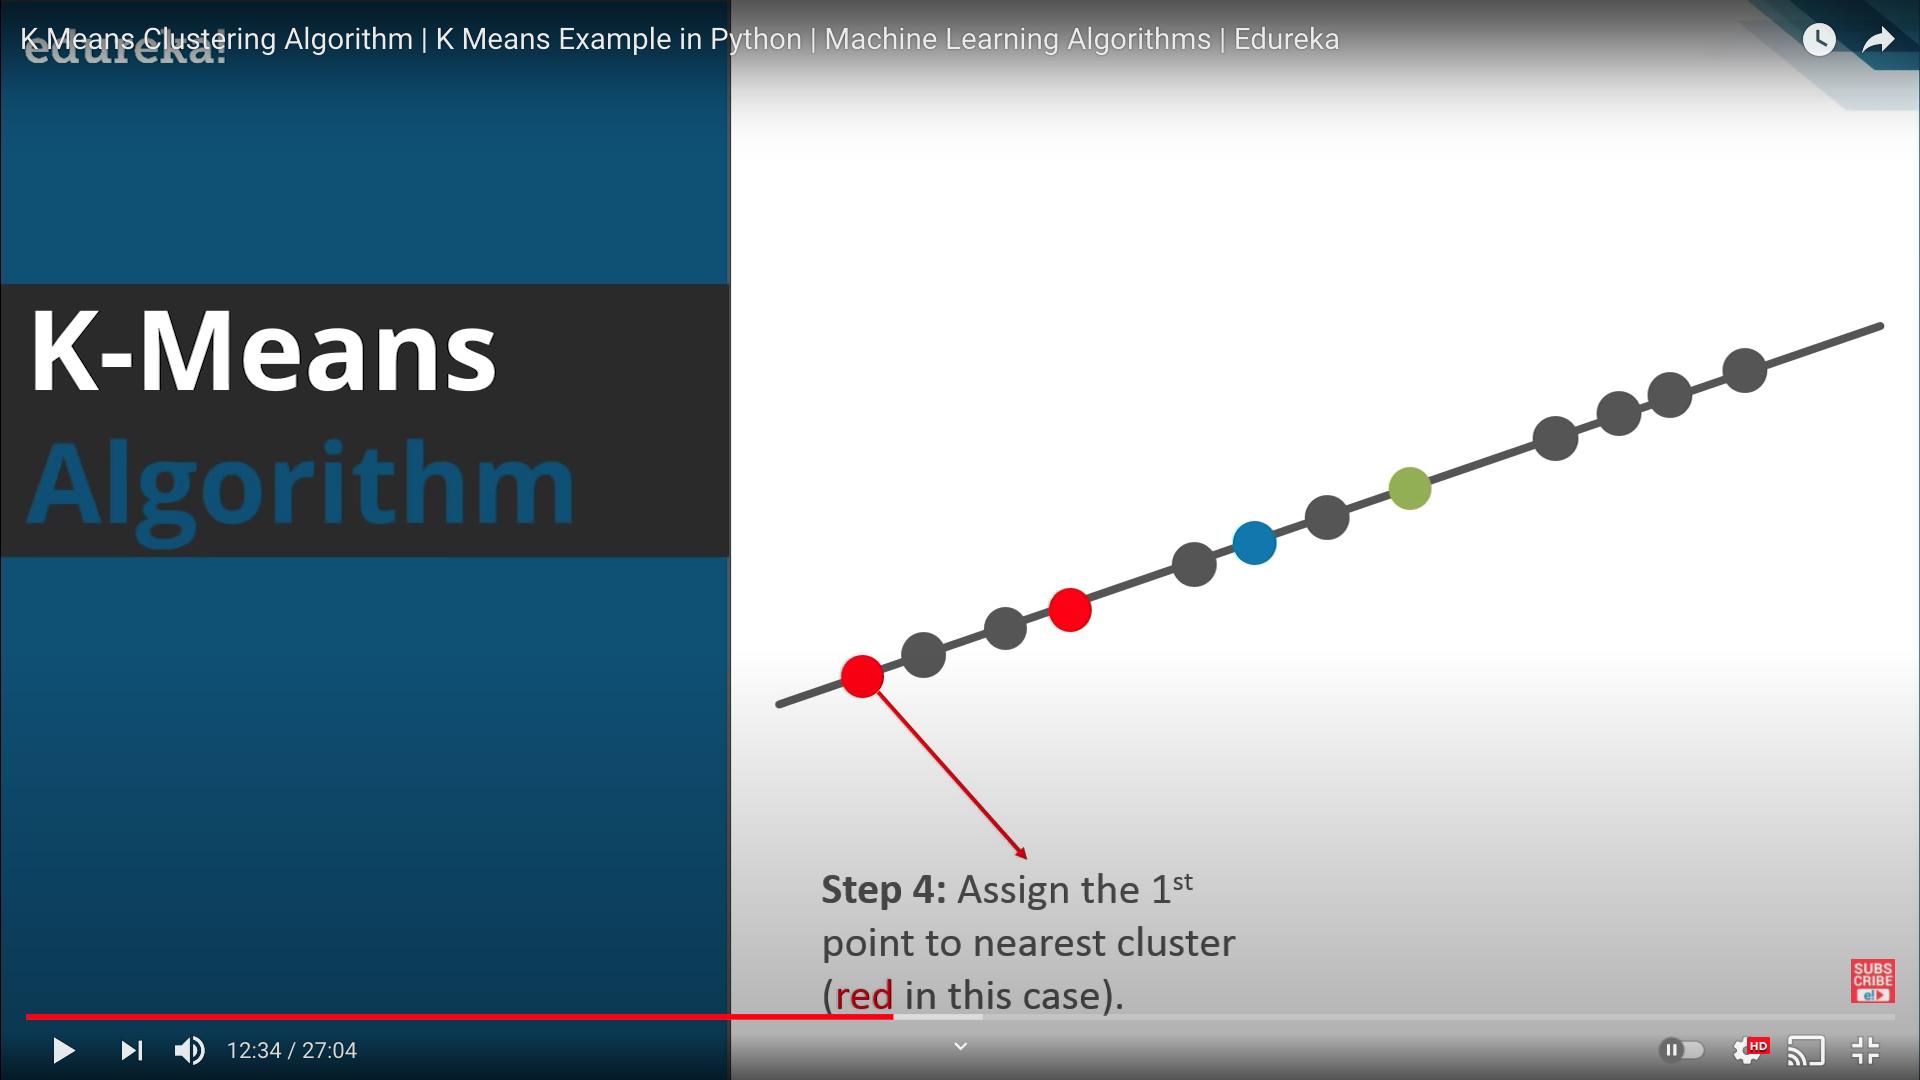
- Step 4: 해당 data point를 최근접 클러스터의 label로 할당
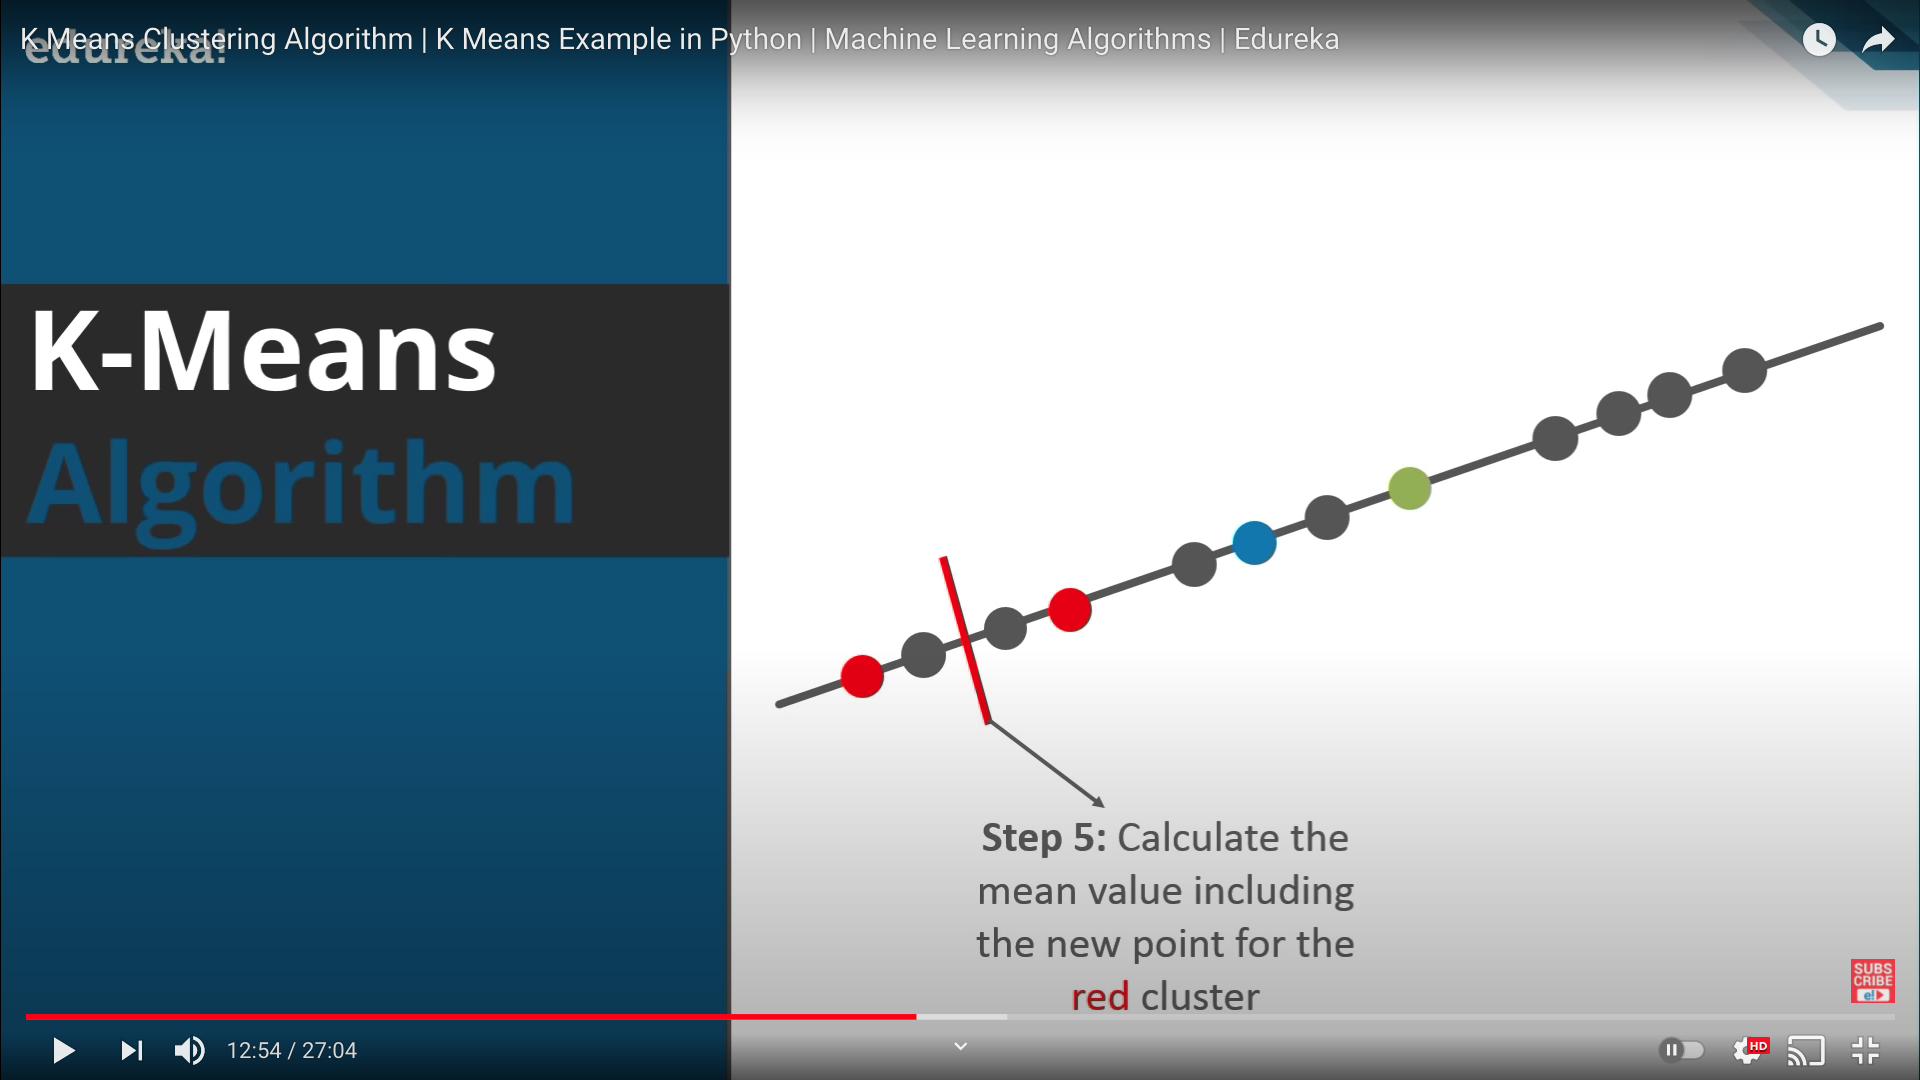
- Step 5: 갱신된 클러스터를 바탕으로 각 클러스터별 속성의 평균값 계산
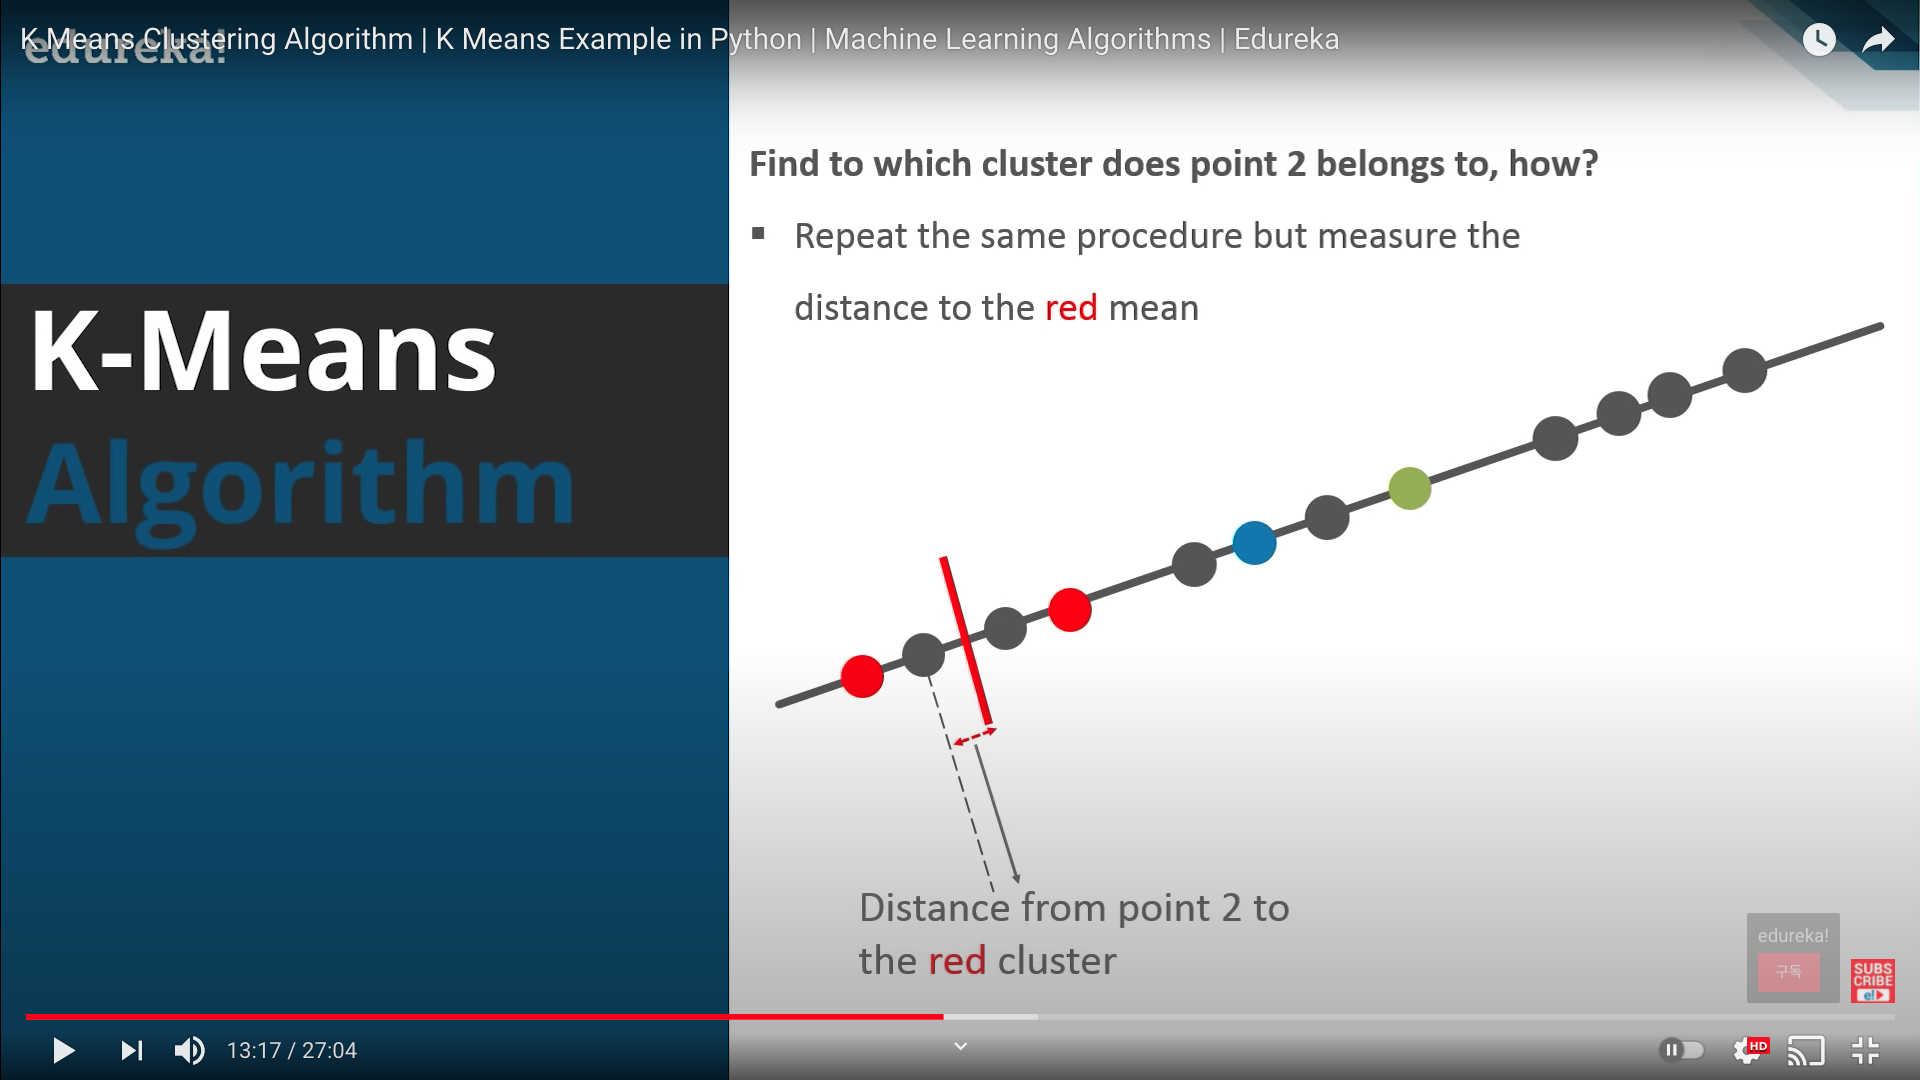
- Step 6: 계산된 평균값을 해당 클러스터의 코어로 가정하여 다음 data point와의 거리 계산 기준으로 삼음
- 이렇게 계산된 클러스터의 평균값을 centroid 라고 함
(반복)
K-Means의 튜닝법
Initial data point 개수 조정
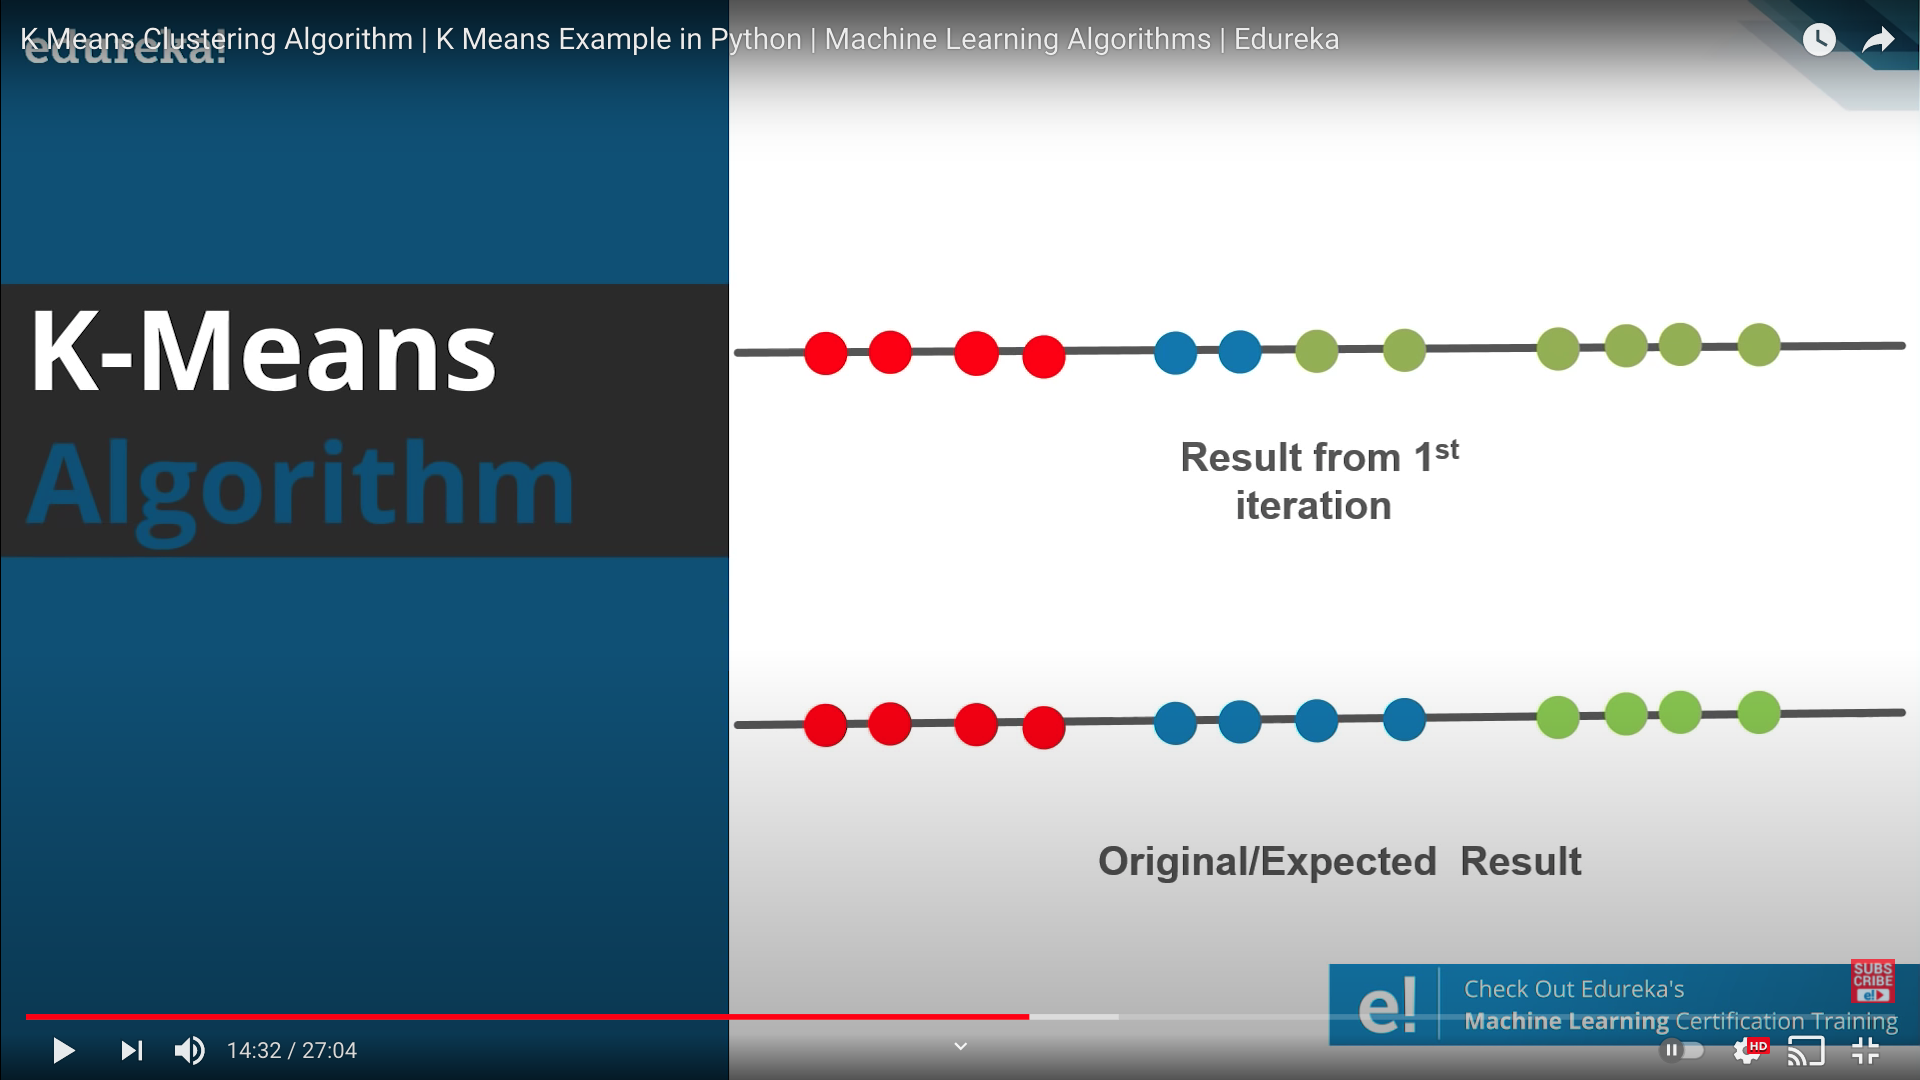
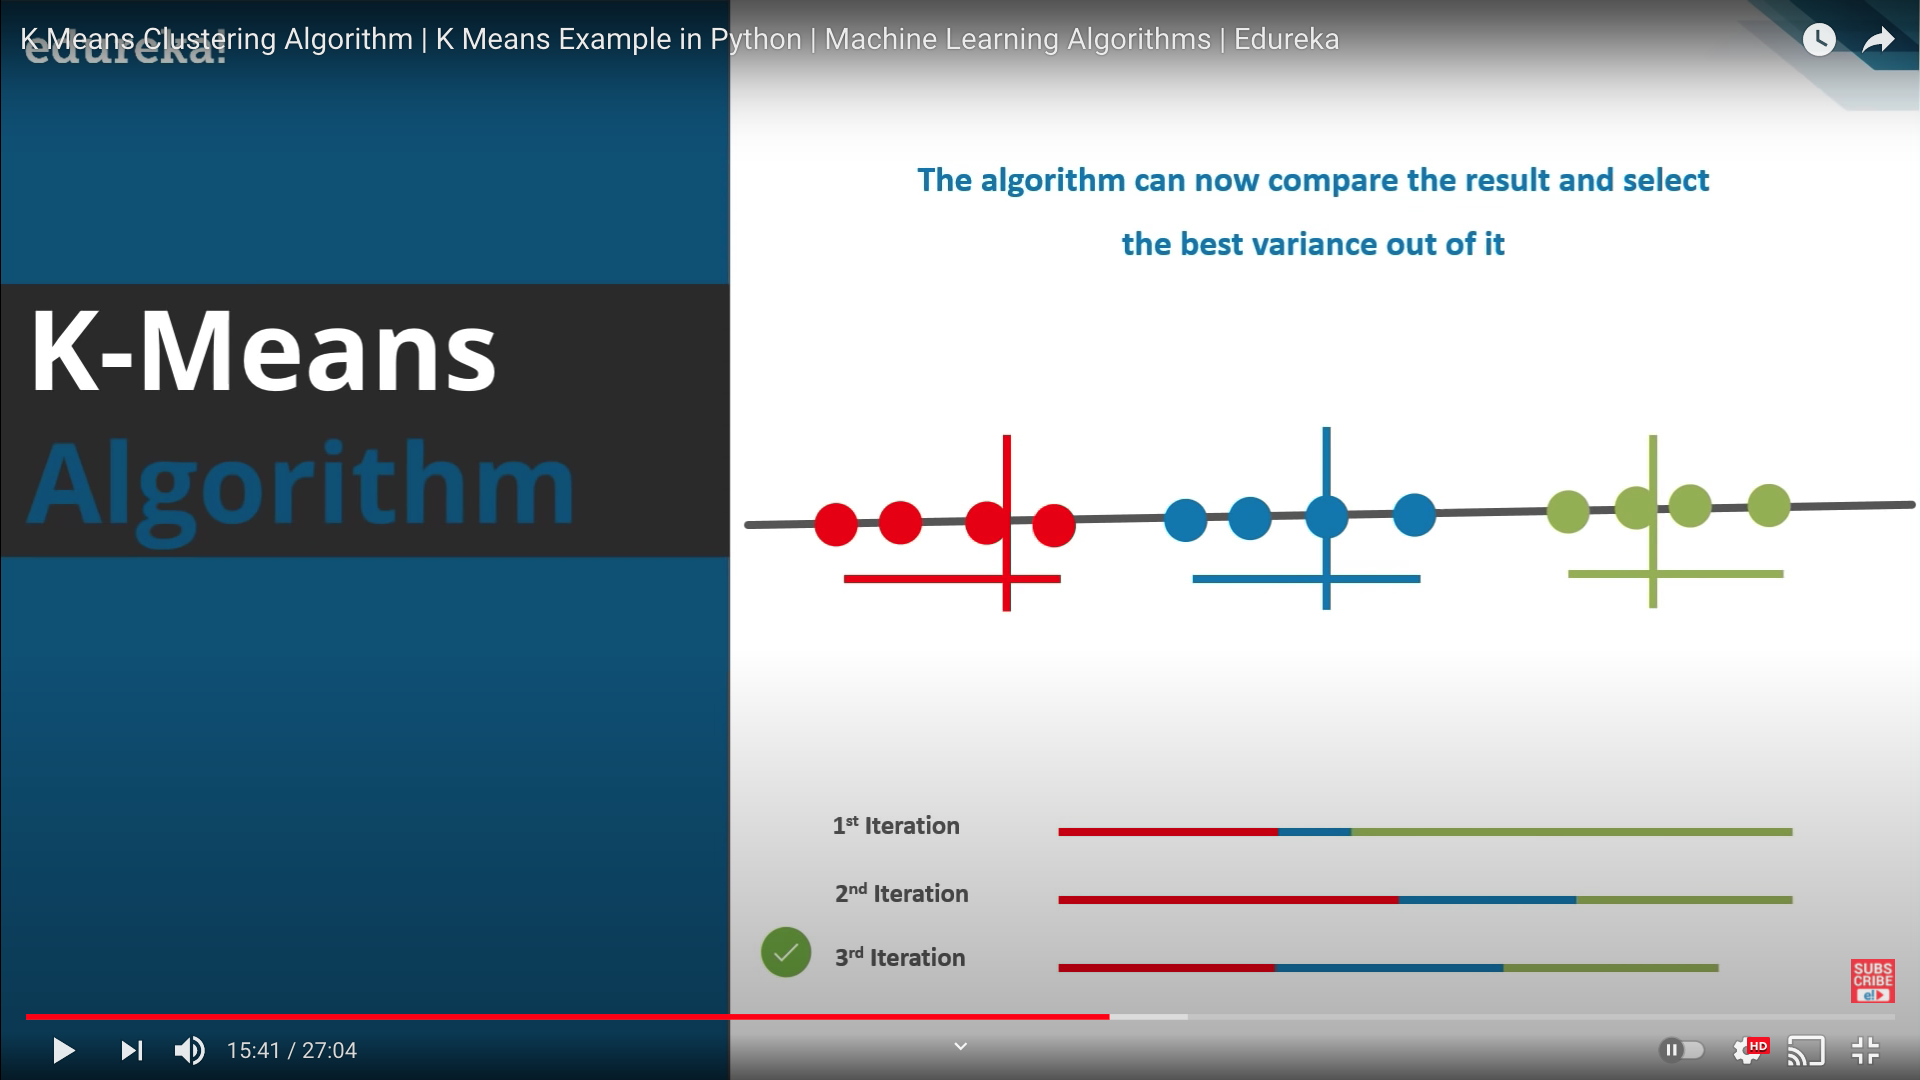
- K-Means를 시행하였을때 휴리스틱한 분류보다 분류 성능이 떨어지는 경우가 있음
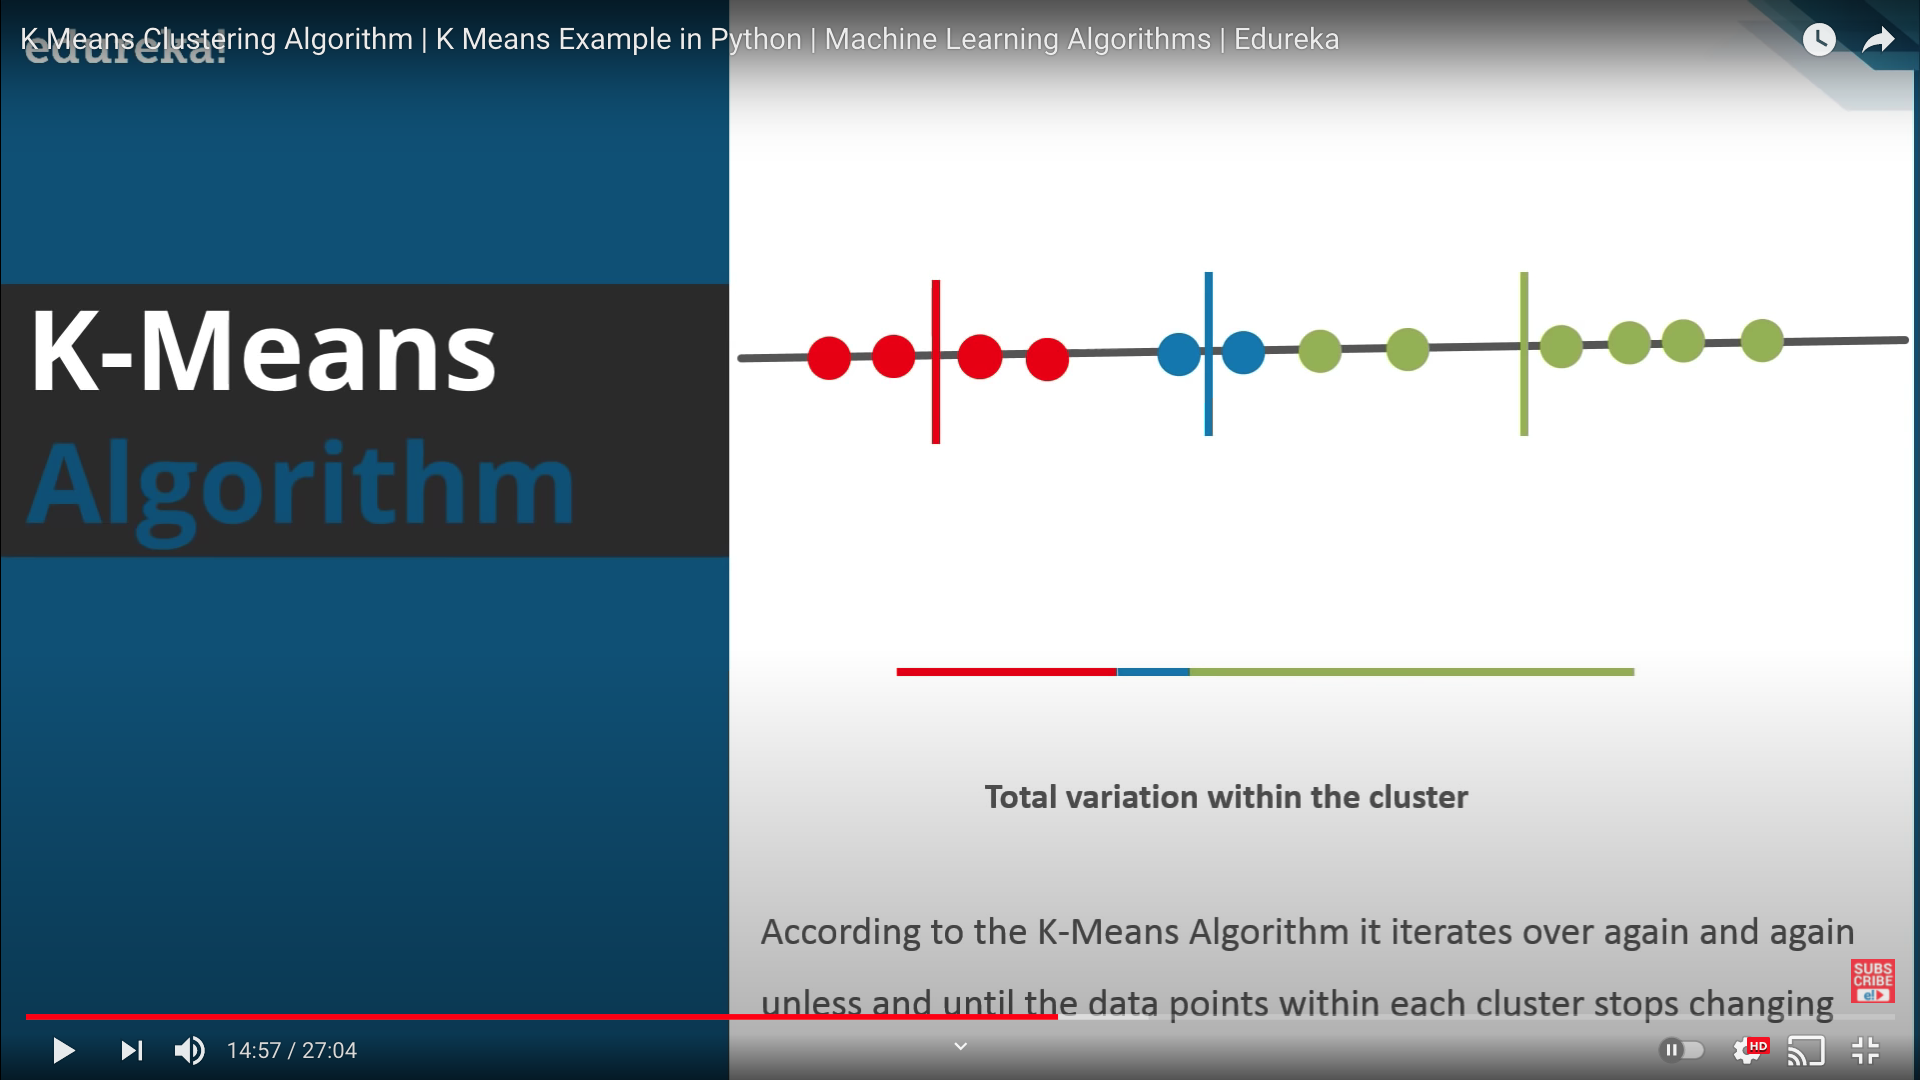
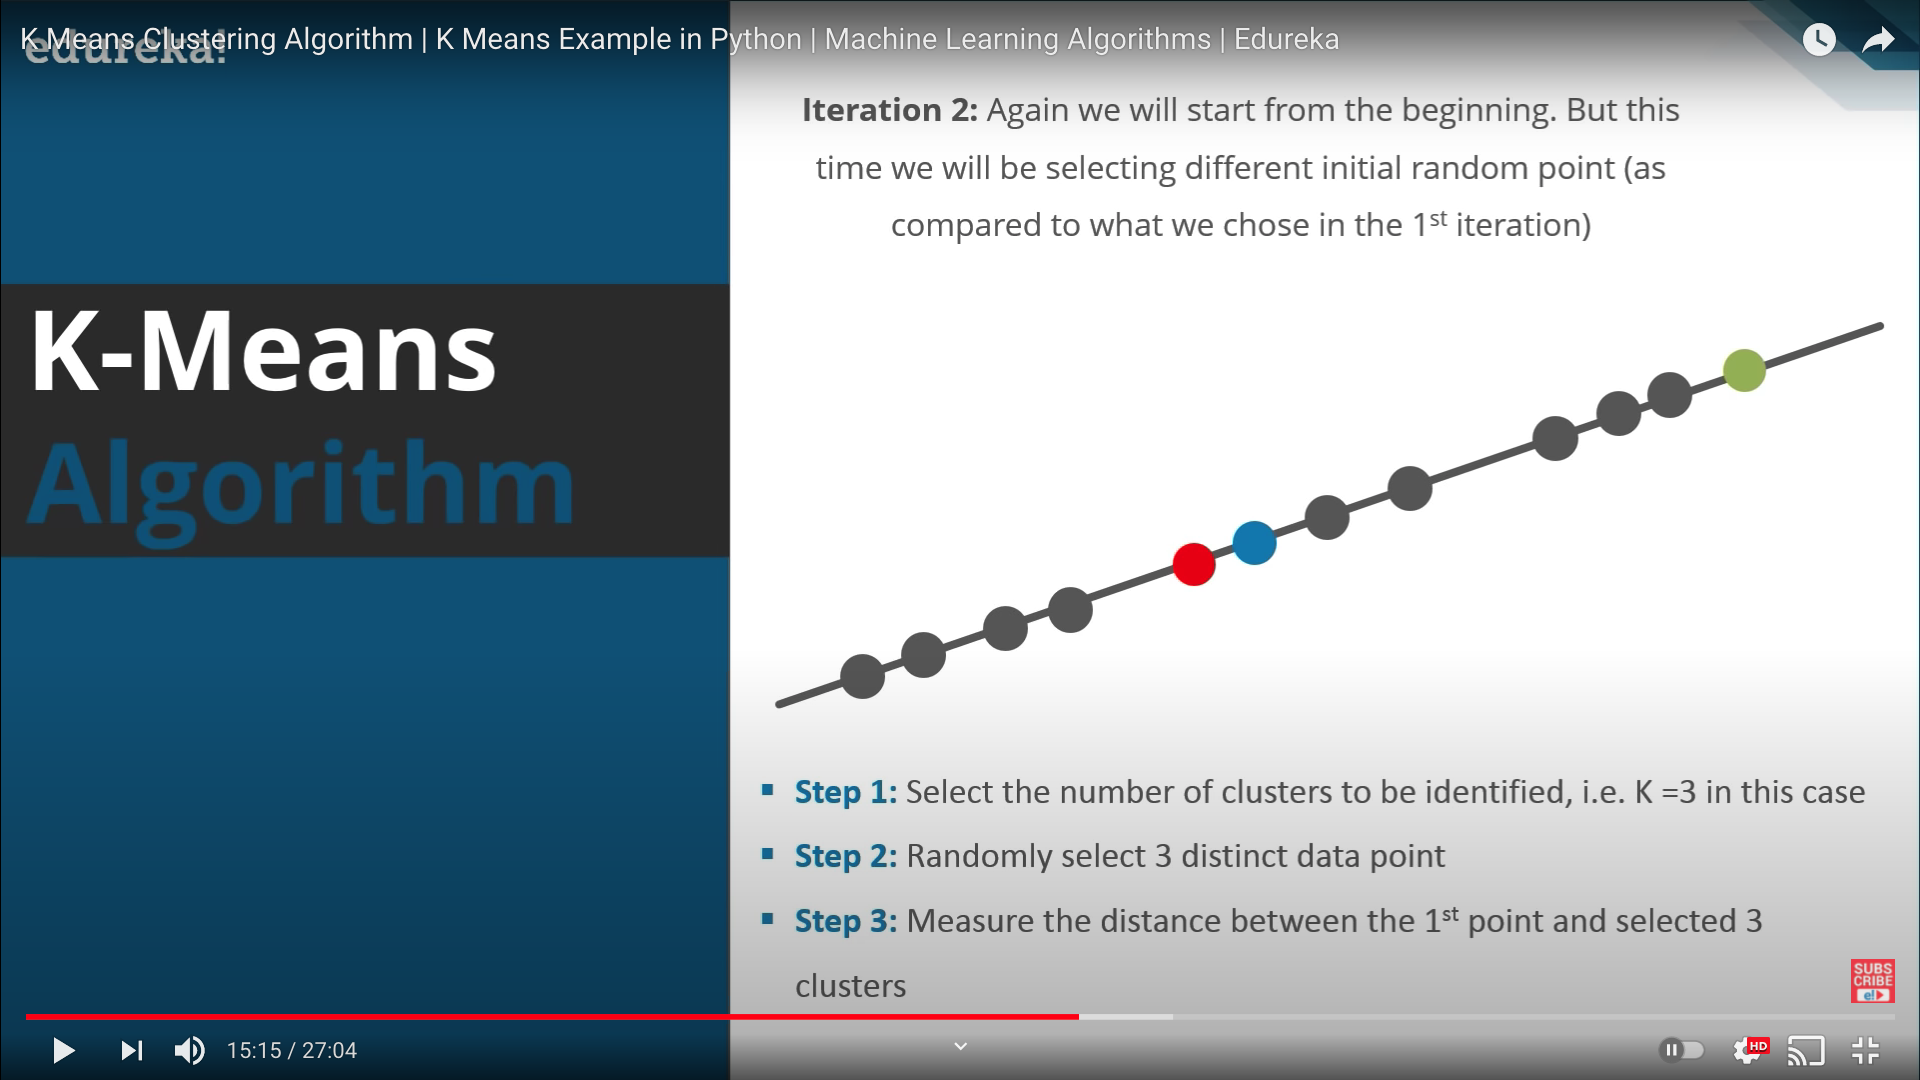
- 그런 경우 initial data points를 바꿔가며 iteration을 주어 각 군집별 분산 값을 줄이는 방향으로 튜닝할 수 있음
1. 최초 분산값 계산
2. initial data point 조정(iter.2 단계)
3. 이전 모델과 분산값 비교
K 값 조정
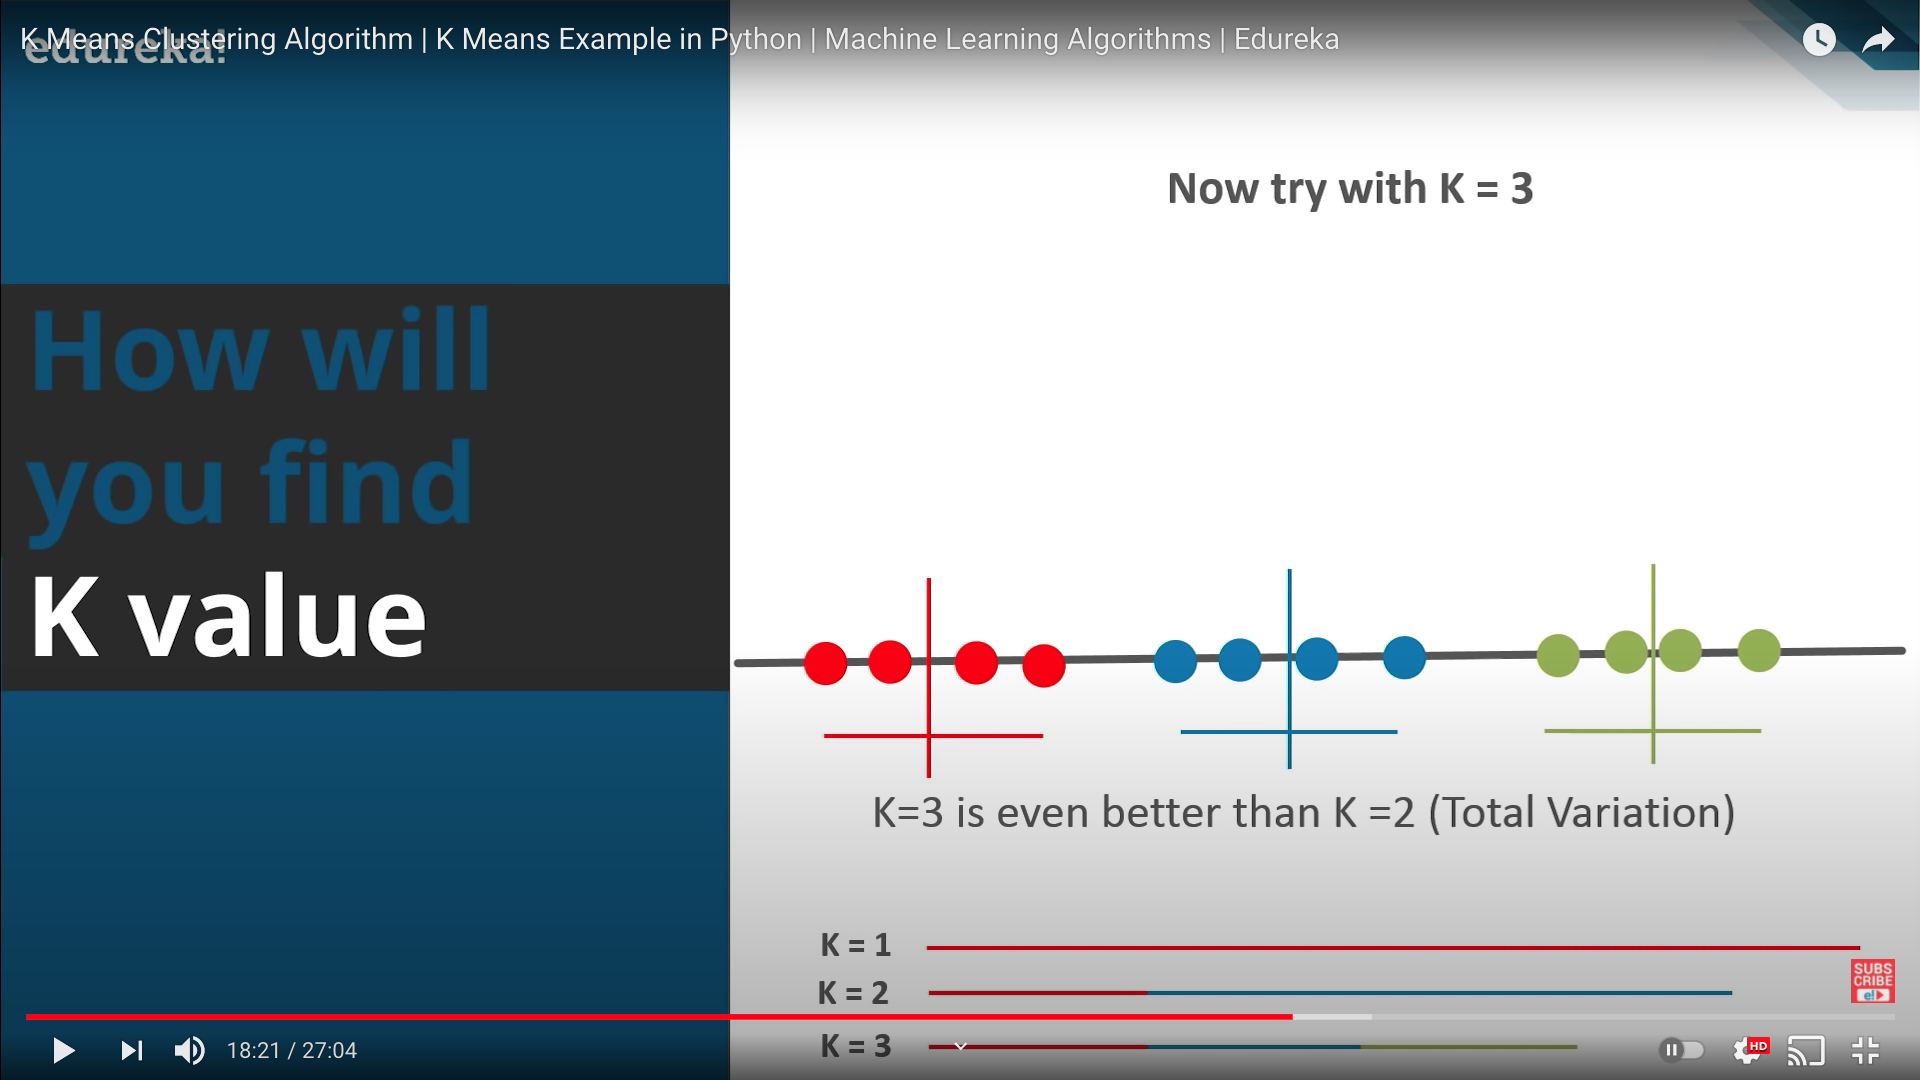 K값을 조정하기 위해 마찬가지로 K값에 따른 분산 비교로 조정할 수 있음
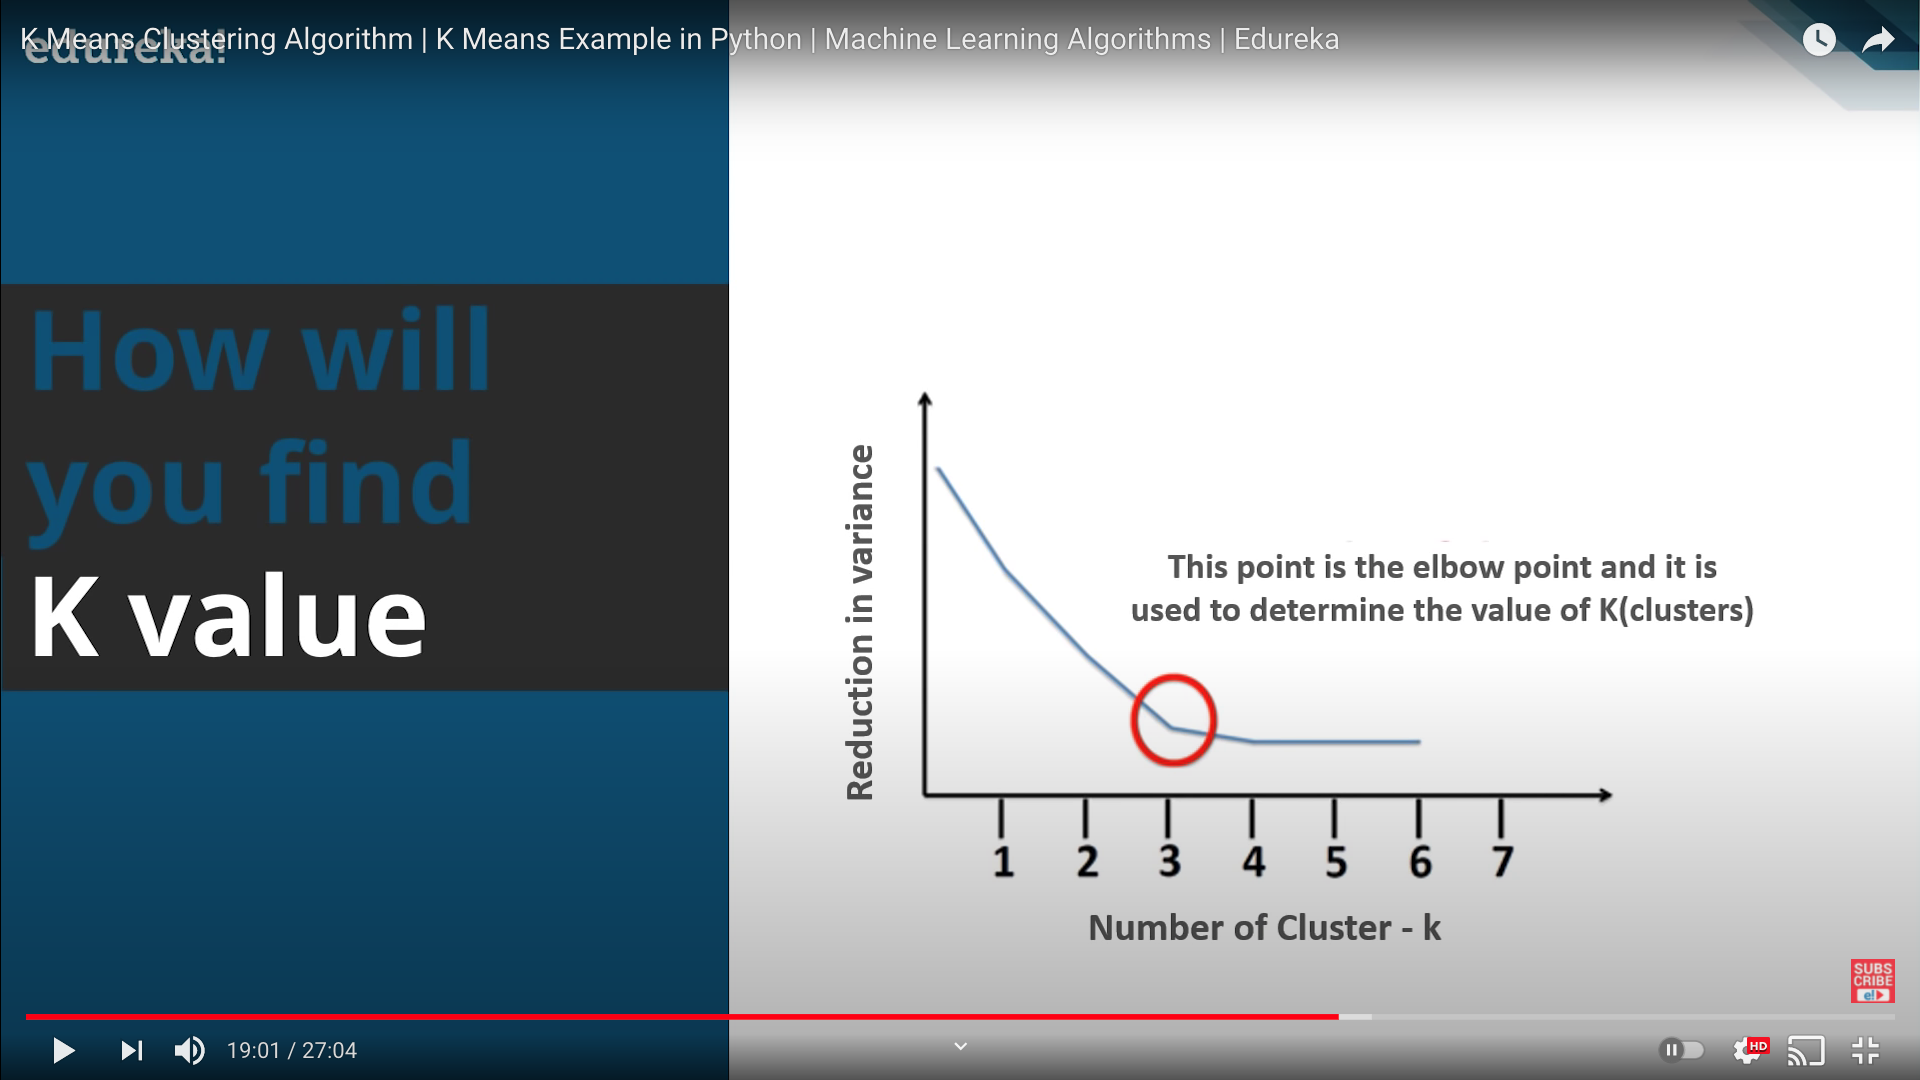 K 값의 조정에 따라 분산이 포화되는 변곡점이 있는데 이 K 값을 elbow point라고 부름
2차원에서의 K-Means 적용
K-Means Vanilla Code
import pandas as pd
import numpy as np
import matplotlib.pyplot as plt
%matplotlib inline

df = pd.DataFrame({
    'x': [12,20,28,18,29,33,24,45,45,52,51,52,55,53,55,61,64,69,72],
    'y': [39,36,30,52,54,46,55,59,63,70,66,63,58,23,14,8,19,7,24]
})

np.random.seed(200)
k = 3
#centrioids[i] = [x, y]
centroids = {
    i+1: [np.random.randint(0, 80), np.random.randint(0,80)]
    for i in range(k)
}

fig = plt.figure(figsize=(5,5))
plt.scatter(df['x'], df['y'], color='k')
colmap = {1: 'r', 2: 'g', 3: 'b'}
for i in centroids.keys():
    plt.scatter(*centroids[i], color=colmap[i])
plt.xlim(0,80)
plt.ylim(0,80)
plt.show
<function matplotlib.pyplot.show(*args, **kw)>

# Assignment Stage
def assignment(df, centroids):
    for i in centroids.keys():
        # sqrt((x1 - x2)^2 - (y1 - y2)^2)
        df['distance_from_{}'.format(i)] = (
            np.sqrt(
                (df['x'] - centroids[i][0])**2
                + (df['y'] - centroids[i][1])**2
            )
        )
    centroid_distance_cols = ['distance_from_{}'.format(i) for i in centroids.keys()]
    df['closest'] = df.loc[:, centroid_distance_cols].idxmin(axis=1)
    df['closest'] = df['closest'].map(lambda x: int(x.lstrip('distance_from_'))) # 인트 변환해서 라벨링
    df['color'] = df['closest'].map(lambda x: colmap[x]) # 컬러도 라벨링
    return df

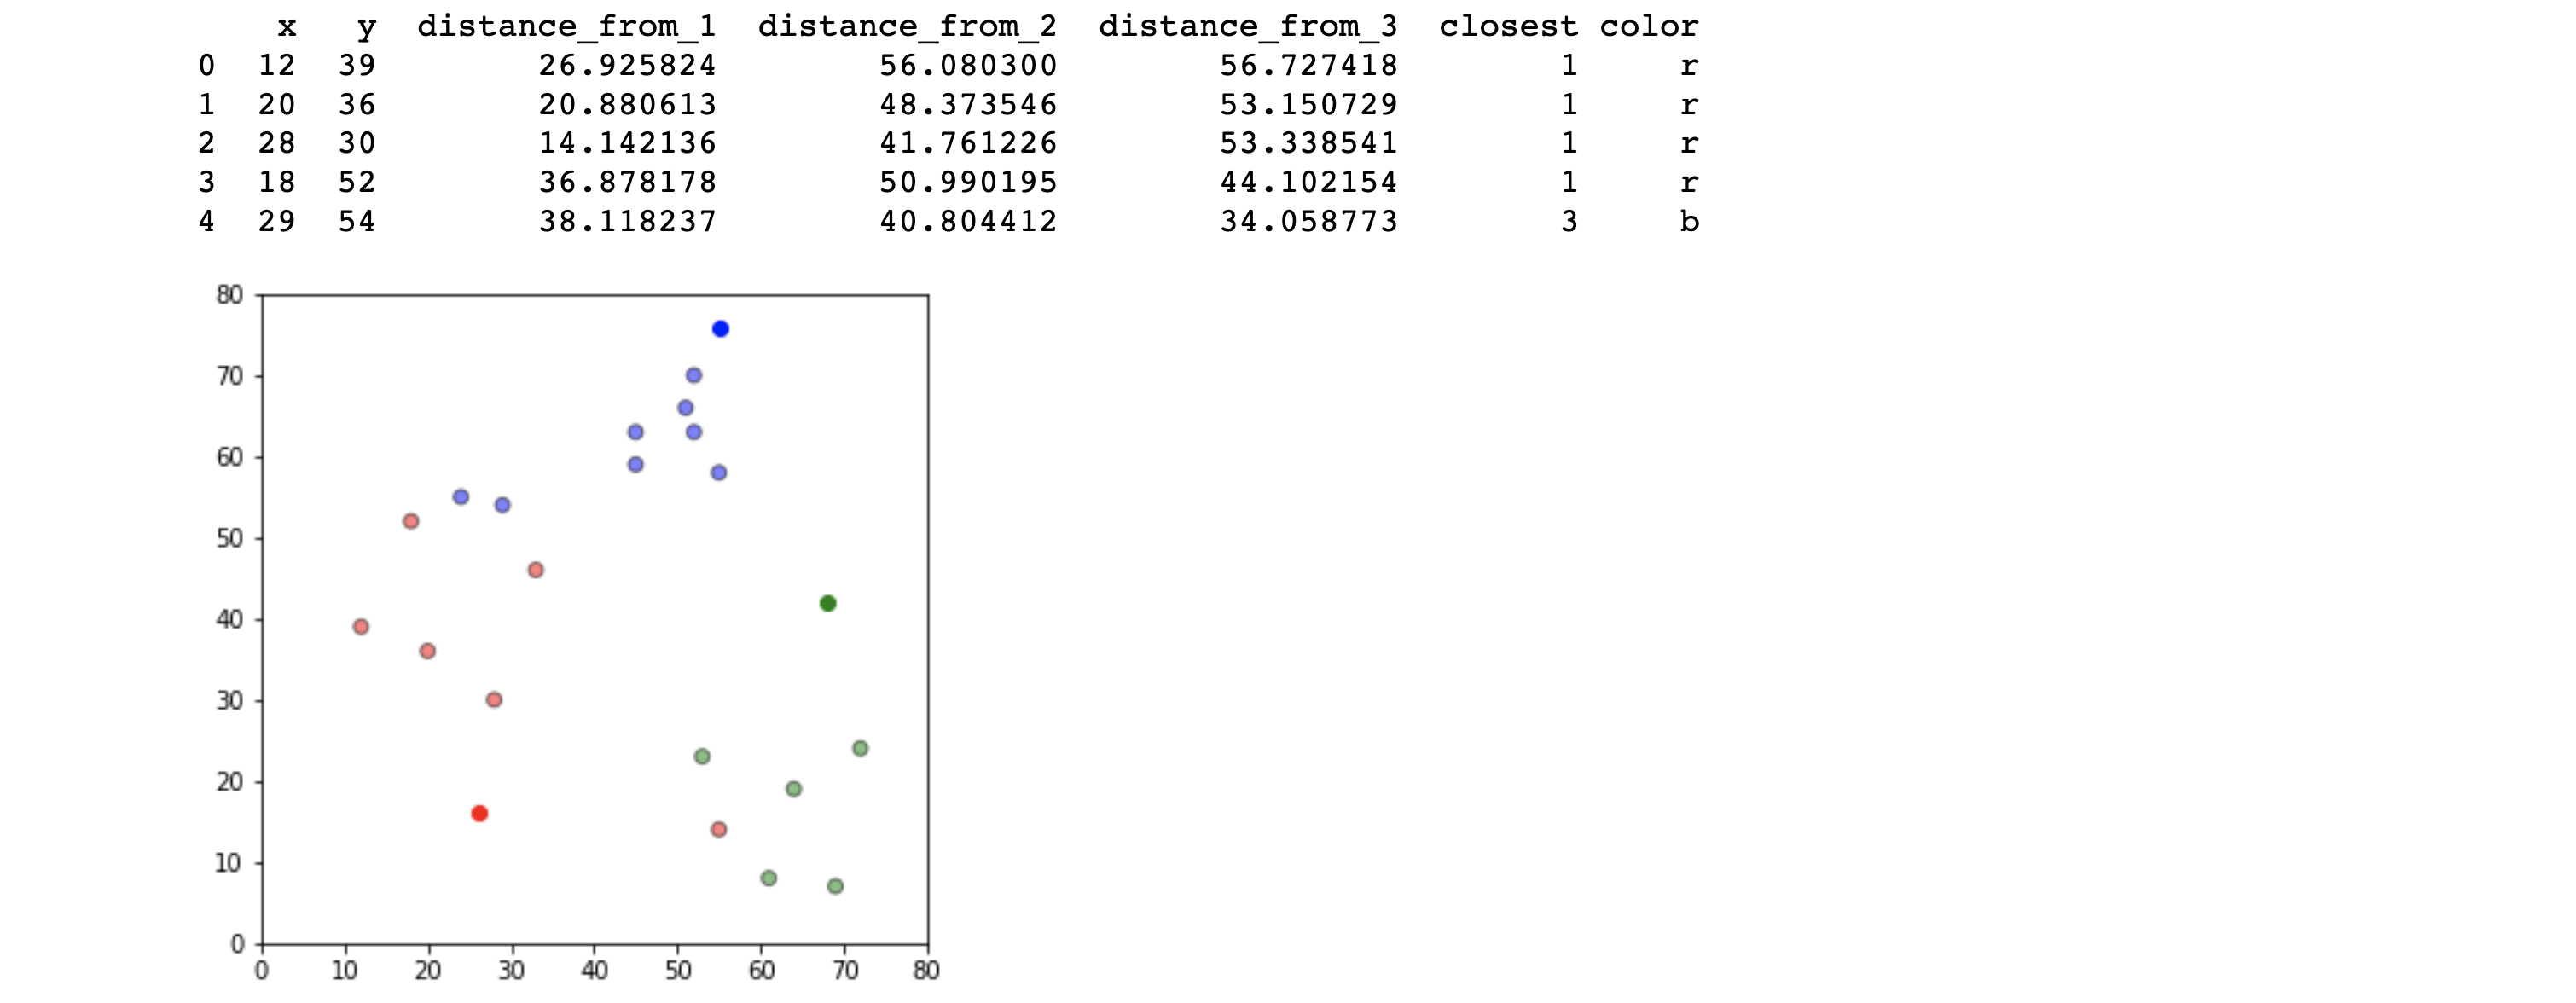
df = assignment(df, centroids)
print(df.head())

fig = plt.figure(figsize=(5,5))
plt.scatter(df['x'], df['y'], color=df['color'], alpha=0.5, edgecolor='k')
for i in centroids.keys():
    plt.scatter(*centroids[i], color=colmap[i])
plt.xlim(0, 80)
plt.ylim(0, 80)
plt.show()
# Update Stage
import copy

old_centroids = copy.deepcopy(centroids)

def update(k):
    for i in centroids.keys():
        centroids[i][0] = np.mean(df[df['closest'] == i]['x']) # 여기 잘 이해가 안 됨
        centroids[i][1] = np.mean(df[df['closest'] == i]['y'])
    return k

centroids = update(centroids)

fig = plt.figure(figsize=(5,5))
ax = plt.axes()
plt.scatter(df['x'], df['y'], color=df['color'], alpha=0.5, edgecolor='k')
for i in centroids.keys():
    plt.scatter(*centroids[i], color=colmap[i])
plt.xlim(0,80)
plt.ylim(0,80)
for i in old_centroids.keys():                        # 여기 뭐임
    old_x = old_centroids[i][0]
    old_y = old_centroids[i][1]
    dx = (centroids[i][0] - old_centroids[i][0])*0.75
    dy = (centroids[i][1] - old_centroids[i][1])*0.75
    ax.arrow(old_x, old_y, dx, dy, head_width=2, head_length=3, fc=colmap[i], ec=colmap[i])
plt.show()

# Repeat Assignment Stage
df = assignment(df, centroids)

# Plot results
fig = plt.figure(figsize=(5,5))
plt.scatter(df['x'], df['y'], color=df['color'], alpha=0.5, edgecolor='k')
for i in centroids.keys():
    plt.scatter(*centroids[i], color=colmap[i])
plt.xlim(0, 80)
plt.ylim(0,80)
plt.show()

# Continue untill all assigned categories don't change anymore
while True:
    closest_centroids = df['closest'].copy(deep=True)
    centroids = update(centroids)
    df = assignment(df, centroids)
    if closest_centroids.equals(df['closest']):
        break

fig = plt.figure(figsize=(5,5))
plt.scatter(df['x'], df['y'], color=df['color'], alpha=0.5, edgecolor='k')
for i in centroids.keys():
    plt.scatter(*centroids[i], color=colmap[i])
plt.xlim(0,80)
plt.ylim(0,80)
plt.show()

df = pd.DataFrame({
    'x': [12,20,28,18,29,33,24,45,45,52,51,52,55,53,55,61,64,69,72],
    'y': [39,36,30,52,54,46,55,59,63,70,66,63,58,23,14,8,19,7,24]
})

from sklearn.cluster import KMeans

kmeans = KMeans(n_clusters=3)
kmeans.fit(df)
labels = kmeans.predict(df)
centroids = kmeans.cluster_centers_
fig = plt.figure(figsize=(5,5))
colors = map(lambda x: colmap[x+1], labels)
colors1 = list(colors)
plt.scatter(df['x'], df['y'], color=colors1, alpha=0.5, edgecolor='k')
for idx, centroid in enumerate(centroids):
    plt.scatter(*centroid, color=colmap[idx+1])
plt.xlim(0, 80)
plt.ylim(0, 80)
plt.show()

